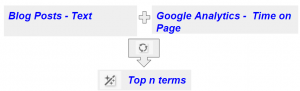
In the previous post we looked how to download data from WordPress blog. [1] So now we can have blog data. We can get also web metrics data from Google Analytics such us the number of views, time on the page. How do we connect post text data with metrics data to see how different topics/keywords correlate with different metrics data? Or may be we want to know what terms contribute to higher time on page or number of views?
Here is the experiment that we can do to check how we can combine blog post text data with web metrics. I downloaded data from blog and saved in the csv file. This is actually same file that was obtained in [1].
In this file time on page from Google Analytics was added manually as additional column. The python program was created. In the program the numeric value in sec is converted in two labels 0 and 1 where 0 is assigned if time less than 120 sec, otherwise 1 is assigned.
Then machine learning was applied as below:
   for each label
            load the post data that have this label from file
            apply TfidfVectorizer
            cluster data
            save data in dataframe
    print dataframe
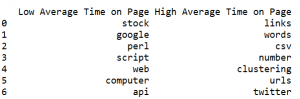
So the dataframe will show distribution of keywords for groups of posts with different time on page.
This is useful if we are interesting why some posts doing well and some not.
Below is sample output and source code:
# -*- coding: utf-8 -*-

from sklearn.cluster import KMeans
from sklearn.feature_extraction.text import TfidfVectorizer
import numpy as np
import pandas as pd

pd.set_option('max_columns', 50)

#only considers the top n words ordered by term frequency
n_features=250
use_idf=True
number_of_runs = 3

import csv
import re

def remove_html_tags(text):
        """Remove html tags from a string"""
        clean = re.compile('<.*?>')
        return re.sub(clean, '', text)


fn="posts.csv"
labelsY=[0,1]
k=3

exclude_words=['row', 'rows', 'print', 'new', 'value', 'column', 'count', 'page', 'short', 'means', 'newline', 'file', 'results']
columns = ['Low Average Time on Page', 'High Average Time on Page']
index = np.arange(50) # array of numbers for the number of samples
df = pd.DataFrame(columns=columns , index = index)

for z in range(len(labelsY)):

    doc_set = []

    with open(fn, encoding="utf8" ) as f:
                csv_f = csv.reader(f)
                for i, row in enumerate(csv_f):
                   if i > 1 and len(row) > 1 :
                       include_this = False
                       if  labelsY[z] ==0:
                           if (int(row[3])) < 120 :
                               include_this=True
                       if  labelsY[z] ==1:
                            if (int(row[3])) >= 120 :
                               include_this=True

                       if  include_this:
                             temp=remove_html_tags(row[1])
                             temp=row[0] + " " + temp
                             temp = re.sub("[^a-zA-Z ]","", temp)

                             for word in exclude_words:
                               if word in temp:
                                        temp=temp.replace(word,"")
                             doc_set.append(temp)


    vectorizer = TfidfVectorizer(max_df=0.5, max_features=n_features,
                                         min_df=2, stop_words='english',
                                         use_idf=use_idf)


    X = vectorizer.fit_transform(doc_set)
    print("n_samples: %d, n_features: %d" % X.shape)

    km = KMeans(n_clusters=k, init='k-means++', max_iter=100, n_init=1)
    km.fit(X)
    order_centroids = km.cluster_centers_.argsort()[:, ::-1]
    terms = vectorizer.get_feature_names()
    count=0
    for i in range(k):
          print("Cluster %d:" % i, end='')
          for ind in order_centroids[i, :10]:
                   print(' %s' % terms[ind], end='')
                   df.set_value(count, columns[z], terms[ind])
                   count=count+1

print ("\n")
print (df)
References
1. Retrieving Post Data Using the WordPress API with Python Script