How to Create Data Visualization for Association Rules in Data Mining

Association rule learning is used in machine learning for discovering interesting relations between variables. Apriori algorithm is a popular algorithm for association rules mining and extracting frequent itemsets with applications in association rule learning. It has been designed to operate on databases containing transactions, such as purchases by customers of a store (market basket analysis). [1] Besides market basket analysis this algorithm can be applied to other problems. For example in web user navigation domain we can search for rules like customer who visited web page A and page B also visited page C.

Python sklearn library does not have Apriori algorithm but recently I come across post [3] where python library MLxtend was used for Market Basket Analysis. MLxtend has modules for different tasks. In this post I will share how to create data visualization for association rules in data mining using MLxtend for getting association rules and NetworkX module for charting the diagram. First we need to get association rules.

Getting Association Rules from Array Data

To get association rules you can run the following code[4]

dataset = [['Milk', 'Onion', 'Nutmeg', 'Kidney Beans', 'Eggs', 'Yogurt'],
           ['Dill', 'Onion', 'Nutmeg', 'Kidney Beans', 'Eggs', 'Yogurt'],
           ['Milk', 'Apple', 'Kidney Beans', 'Eggs'],
           ['Milk', 'Unicorn', 'Corn', 'Kidney Beans', 'Yogurt'],
           ['Corn', 'Onion', 'Onion', 'Kidney Beans', 'Ice cream', 'Eggs']]
           
           
import pandas as pd
from mlxtend.preprocessing import OnehotTransactions
from mlxtend.frequent_patterns import apriori

oht = OnehotTransactions()
oht_ary = oht.fit(dataset).transform(dataset)
df = pd.DataFrame(oht_ary, columns=oht.columns_)
print (df)           

frequent_itemsets = apriori(df, min_support=0.6, use_colnames=True)
print (frequent_itemsets)

association_rules(frequent_itemsets, metric="confidence", min_threshold=0.7)
rules = association_rules(frequent_itemsets, metric="lift", min_threshold=1.2)
print (rules)

"""
Below is the output
    support                     itemsets
0       0.8                       [Eggs]
1       1.0               [Kidney Beans]
2       0.6                       [Milk]
3       0.6                      [Onion]
4       0.6                     [Yogurt]
5       0.8         [Eggs, Kidney Beans]
6       0.6                [Eggs, Onion]
7       0.6         [Kidney Beans, Milk]
8       0.6        [Kidney Beans, Onion]
9       0.6       [Kidney Beans, Yogurt]
10      0.6  [Eggs, Kidney Beans, Onion]

             antecedants            consequents  support  confidence  lift
0  (Kidney Beans, Onion)                 (Eggs)      0.6        1.00  1.25
1   (Kidney Beans, Eggs)                (Onion)      0.8        0.75  1.25
2                (Onion)   (Kidney Beans, Eggs)      0.6        1.00  1.25
3                 (Eggs)  (Kidney Beans, Onion)      0.8        0.75  1.25
4                (Onion)                 (Eggs)      0.6        1.00  1.25
5                 (Eggs)                (Onion)      0.8        0.75  1.25

"""

Confidence and Support in Data Mining

To select interesting rules we can use best-known constraints which are a minimum thresholds on confidence and support.
Support is an indication of how frequently the itemset appears in the dataset.
Confidence is an indication of how often the rule has been found to be true. [5]

support=rules.as_matrix(columns=['support'])
confidence=rules.as_matrix(columns=['confidence'])

Below is the scatter plot for support and confidence:

Association rules - scatter plot
Association rules – scatter plot

And here is the python code to build scatter plot. Since few points here have the same values I added small random values to show all points.

import random
import matplotlib.pyplot as plt


for i in range (len(support)):
   support[i] = support[i] + 0.0025 * (random.randint(1,10) - 5) 
   confidence[i] = confidence[i] + 0.0025 * (random.randint(1,10) - 5)

plt.scatter(support, confidence,   alpha=0.5, marker="*")
plt.xlabel('support')
plt.ylabel('confidence') 
plt.show()

How to Create Data Visualization with NetworkX for Association Rules in Data Mining

To represent association rules as diagram, NetworkX python library is utilized in this post. Here is the association rule example :
(Kidney Beans, Onion) ==> (Eggs)

Directed graph below is built for this rule and shown below. Arrows are drawn as just thicker blue stubs. The node with R0 identifies one rule, and it will have always incoming and outcoming edges. Incoming edge(s) will represent antecedants and the stub (arrow) will be next to node.

Below is the example of graph for all rules extracted from example dataset.
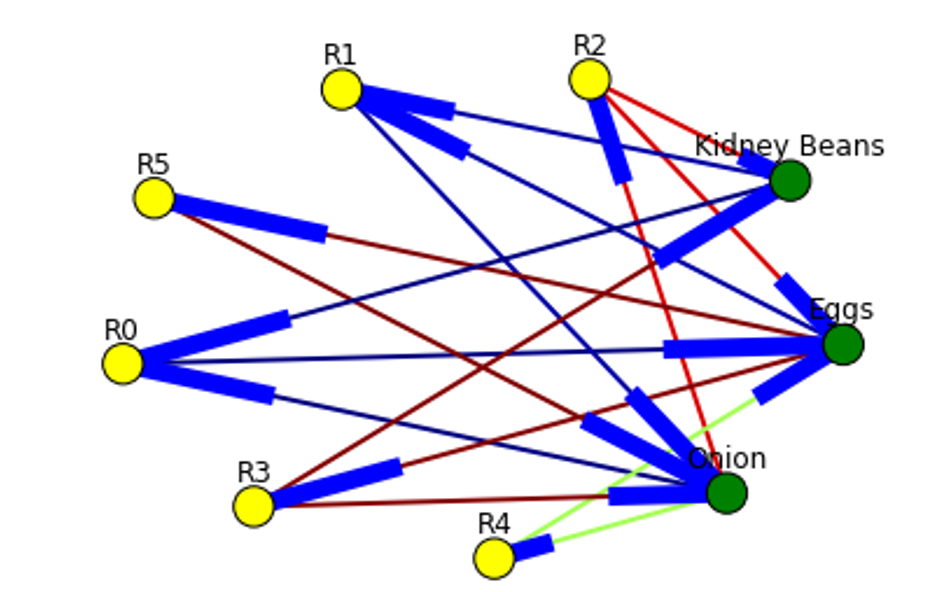
Here is the source code to build association rules with NetworkX. To call function use draw_graph(rules, 6)

def draw_graph(rules, rules_to_show):
  import networkx as nx  
  G1 = nx.DiGraph()
  
  color_map=[]
  N = 50
  colors = np.random.rand(N)    
  strs=['R0', 'R1', 'R2', 'R3', 'R4', 'R5', 'R6', 'R7', 'R8', 'R9', 'R10', 'R11']   
  
  
  for i in range (rules_to_show):      
    G1.add_nodes_from(["R"+str(i)])
   
    
    for a in rules.iloc[i]['antecedants']:
               
        G1.add_nodes_from([a])
       
        G1.add_edge(a, "R"+str(i), color=colors[i] , weight = 2)
      
    for c in rules.iloc[i]['consequents']:
            
            G1.add_nodes_from()
           
            G1.add_edge("R"+str(i), c, color=colors[i],  weight=2)

  for node in G1:
       found_a_string = False
       for item in strs: 
           if node==item:
                found_a_string = True
       if found_a_string:
            color_map.append('yellow')
       else:
            color_map.append('green')       


  edges = G1.edges()
  colors = [G1[u][v]['color'] for u,v in edges]
  weights = [G1[u][v]['weight'] for u,v in edges]

  pos = nx.spring_layout(G1, k=16, scale=1)
  nx.draw(G1, pos, edges=edges, node_color = color_map, edge_color=colors, width=weights, font_size=16, with_labels=False)            
  
  for p in pos:  # raise text positions
           pos[p][1] += 0.07
  nx.draw_networkx_labels(G1, pos)
  plt.show()

Data Visualization for Online Retail Data Set

To get real feeling and testing on visualization we can take available online retail store dataset[6] and apply the code for association rules graph. For downloading retail data and formatting some columns the code from [3] was used.

Below are the result of scatter plot for support and confidence. To build the scatter plot seaborn library was used this time. Also you can find below visualization for association rules (first 10 rules) for retail data set.
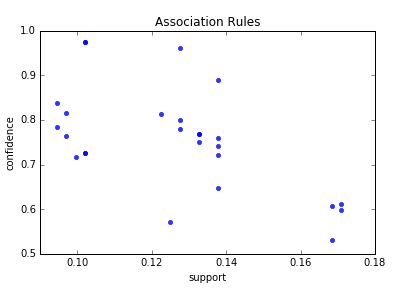
Here is the python full source code for data visualization association rules in data mining.


dataset = [['Milk', 'Onion', 'Nutmeg', 'Kidney Beans', 'Eggs', 'Yogurt'],
           ['Dill', 'Onion', 'Nutmeg', 'Kidney Beans', 'Eggs', 'Yogurt'],
           ['Milk', 'Apple', 'Kidney Beans', 'Eggs'],
           ['Milk', 'Unicorn', 'Corn', 'Kidney Beans', 'Yogurt'],
           ['Corn', 'Onion', 'Onion', 'Kidney Beans', 'Ice cream', 'Eggs']]
           
           
import pandas as pd
from mlxtend.preprocessing import OnehotTransactions
from mlxtend.frequent_patterns import apriori

oht = OnehotTransactions()
oht_ary = oht.fit(dataset).transform(dataset)
df = pd.DataFrame(oht_ary, columns=oht.columns_)
print (df)           

frequent_itemsets = apriori(df, min_support=0.6, use_colnames=True)
print (frequent_itemsets)

from mlxtend.frequent_patterns import association_rules

association_rules(frequent_itemsets, metric="confidence", min_threshold=0.7)
rules = association_rules(frequent_itemsets, metric="lift", min_threshold=1.2)
print (rules)

support=rules.as_matrix(columns=['support'])
confidence=rules.as_matrix(columns=['confidence'])


import random
import matplotlib.pyplot as plt


for i in range (len(support)):
   support[i] = support[i] + 0.0025 * (random.randint(1,10) - 5) 
   confidence[i] = confidence[i] + 0.0025 * (random.randint(1,10) - 5)

plt.scatter(support, confidence,   alpha=0.5, marker="*")
plt.xlabel('support')
plt.ylabel('confidence') 
plt.show()

import numpy as np

def draw_graph(rules, rules_to_show):
  import networkx as nx  
  G1 = nx.DiGraph()
  
  color_map=[]
  N = 50
  colors = np.random.rand(N)    
  strs=['R0', 'R1', 'R2', 'R3', 'R4', 'R5', 'R6', 'R7', 'R8', 'R9', 'R10', 'R11']   
  
  
  for i in range (rules_to_show):      
    G1.add_nodes_from(["R"+str(i)])
   
    
    for a in rules.iloc[i]['antecedants']:
               
        G1.add_nodes_from([a])
       
        G1.add_edge(a, "R"+str(i), color=colors[i] , weight = 2)
      
    for c in rules.iloc[i]['consequents']:
            
            G1.add_nodes_from()
           
            G1.add_edge("R"+str(i), c, color=colors[i],  weight=2)

  for node in G1:
       found_a_string = False
       for item in strs: 
           if node==item:
                found_a_string = True
       if found_a_string:
            color_map.append('yellow')
       else:
            color_map.append('green')       


  edges = G1.edges()
  colors = [G1[u][v]['color'] for u,v in edges]
  weights = [G1[u][v]['weight'] for u,v in edges]

  pos = nx.spring_layout(G1, k=16, scale=1)
  nx.draw(G1, pos, edges=edges, node_color = color_map, edge_color=colors, width=weights, font_size=16, with_labels=False)            
  
  for p in pos:  # raise text positions
           pos[p][1] += 0.07
  nx.draw_networkx_labels(G1, pos)
  plt.show()

    
draw_graph (rules, 6)   


df = pd.read_excel('http://archive.ics.uci.edu/ml/machine-learning-databases/00352/Online%20Retail.xlsx')


df['Description'] = df['Description'].str.strip()
df.dropna(axis=0, subset=['InvoiceNo'], inplace=True)
df['InvoiceNo'] = df['InvoiceNo'].astype('str')
df = df[~df['InvoiceNo'].str.contains('C')]

basket = (df[df['Country'] =="France"]
          .groupby(['InvoiceNo', 'Description'])['Quantity']
          .sum().unstack().reset_index().fillna(0)
          .set_index('InvoiceNo'))

def encode_units(x):
    if x <= 0:
        return 0
    if x >= 1:
        return 1

basket_sets = basket.applymap(encode_units)
basket_sets.drop('POSTAGE', inplace=True, axis=1)

frequent_itemsets = apriori(basket_sets, min_support=0.07, use_colnames=True)

rules = association_rules(frequent_itemsets, metric="lift", min_threshold=1)
rules.head()

print (rules)


support=rules.as_matrix(columns=['support'])
confidence=rules.as_matrix(columns=['confidence'])

import seaborn as sns1

for i in range (len(support)):
    support[i] = support[i] 
    confidence[i] = confidence[i] 
    
plt.title('Association Rules')
plt.xlabel('support')
plt.ylabel('confidence')    
sns1.regplot(x=support, y=confidence, fit_reg=False)

plt.gcf().clear()
draw_graph (rules, 10)  

References

1. MLxtend Apriori
2. mlxtend-latest
3. Introduction to Market Basket Analysis in Python
4. MLxtends-documentation
5. Association rule learning
6. Online Retail Data Set


Data Visualization of Word Correlations with NetworkX

This is a continuation of my previous post, found here Combining Machine Learning and Data Scraping. Data visualization is added to show correlations between words. The graph was built using NetworkX python library.
The input for the graph is the array corr_data with 3 columns : pair of words and correlation between them. This was calculated in the previous post.

In this post are added two functions:
build_graph_for_all – it is taking words from matrix for the first N rows and adding to the graph.
The graph is shown below.

The Second function build_graph is taking specific word and adding to graph only edge that have this word. The process is repeating but now it is adding edges to other words on the graph. This is recursive function. Below in the python code are shown these functions.

Python computer code:


import networkx as nx
import matplotlib.pyplot as plt
G=nx.Graph()

existing_edges = {}

def build_graph(w, lev):
  if (lev > 5)  :
      return
  for z in corr_data:
     ind=-1 
     if z[0] == w:
         ind=0
         ind1=1
     if z[1] == w:
         ind ==1
         ind1 =0
         
     if ind == 0 or ind == 1:
         if  str(w) + "_" + str(corr_data[ind1]) not in existing_edges :
            
             G.add_node(str(corr_data[ind]))
             existing_edges[str(w) + "_" + str(corr_data[ind1])] = 1;
             G.add_edge(w,str(corr_data[ind1]))
            
             build_graph(corr_data[ind1], lev+1)


existing_nodes = {}
def build_graph_for_all():
    count=0
    for d in corr_data:
        if (count > 40) :
            return
        if  d[0] not in existing_edges :
             G.add_node(str(d[0]))
        if  d[1] not in existing_edges :     
             G.add_node(str(d[1]))
        G.add_edge(str(d[0]), str(d[1]))     
        count=count + 1


build_graph_for_all()

print (G.nodes(data=True))
plt.show()
nx.draw(G, width=2, with_labels=True)
plt.savefig("path1.png")


w="design"
G.add_node(w)
build_graph(w, 0)
 
print (G.nodes(data=True))
plt.show()
nx.draw(G, width=2, with_labels=True)
plt.savefig("path.png")

In this post we created script that can be used to draw plot of connections between the words. In the near future I am planning to apply this technique to real problem. Below is the full source code.


# -*- coding: utf-8 -*-

import numpy as np
import nltk
import csv
import re
from scipy.stats.stats import pearsonr   

def remove_html_tags(text):
        """Remove html tags from a string"""
        clean = re.compile('<.*?>')
        return re.sub(clean, '', text)


fn="C:\\Users\\Owner\\Desktop\\A\\Scrapping\\craigslist\\result-jobs-multi-pages-content.csv"

docs=[]
def load_file(fn):
         start=1
         file_urls=[]
         
         strtext=""
         with open(fn, encoding="utf8" ) as f:
            csv_f = csv.reader(f)
            for i, row in enumerate(csv_f):
               if i >=  start  :
                 file_urls.append (row)
                
                 strtext=strtext + replaceNotNeeded(str(stripNonAlphaNum(row[5])))
                 docs.append (str(stripNonAlphaNum(row[5])))
                
         return strtext  
     

# Given a text string, remove all non-alphanumeric
# characters (using Unicode definition of alphanumeric).

def stripNonAlphaNum(text):
    import re
    return re.compile(r'\W+', re.UNICODE).split(text)

def replaceNotNeeded(text):
    text=text.replace("'","").replace(",","").replace ("''","").replace("'',","")
    text=text.replace(" and ", " ").replace (" to ", " ").replace(" a "," ").replace(" the "," ").replace(" of "," ").replace(" in "," ").replace(" for ", " ").replace(" or ", " ")
    text=text.replace(" will ", " ").replace (" on ", " ").replace(" be "," ").replace(" with "," ").replace(" is "," ").replace(" as "," ")
    text=text.replace("    "," ").replace("   "," ").replace("  "," ")
    return text

txt=load_file(fn)
print (txt)

tokens = nltk.wordpunct_tokenize(str(txt))

my_count = {}
for word in tokens:
    try: my_count[word] += 1
    except KeyError: my_count[word] = 1

print (my_count)


data = []

sortedItems = sorted(my_count , key=my_count.get , reverse = True)
item_count=0
for element in sortedItems :
       if (my_count.get(element) > 3):
           data.append([element, my_count.get(element)])
           item_count=item_count+1


N=5
topN = []
corr_data =[]
for z in range(N):
    topN.append (data[z][0])


wcount = [[0 for x in range(500)] for y in range(2000)] 
docNumber=0     
for doc in docs:
    
    for z in range(item_count):
        
        wcount[docNumber][z] = doc.count (data[z][0])
    docNumber=docNumber+1

print ("calc correlation")        
     
for ii in range(N-1):
    for z in range(item_count):
       
        r_row, p_value = pearsonr(np.array(wcount)[:, ii], np.array(wcount)[:, z])
        print (r_row, p_value)
        if r_row > 0.6 and r_row < 1:
               corr_data.append ([topN[ii],  data[z][0], r_row])
        
print ("correlation data")
print (corr_data)


import networkx as nx
import matplotlib.pyplot as plt
G=nx.Graph()

existing_edges = {}

def build_graph(w, lev):
  if (lev > 5)  :
      return
  for z in corr_data:
     ind=-1 
     if z[0] == w:
         ind=0
         ind1=1
     if z[1] == w:
         ind ==1
         ind1 =0
         
     if ind == 0 or ind == 1:
         if  str(w) + "_" + str(corr_data[ind1]) not in existing_edges :
            
             G.add_node(str(corr_data[ind]))
             existing_edges[str(w) + "_" + str(corr_data[ind1])] = 1;
             G.add_edge(w,str(corr_data[ind1]))
            
             build_graph(corr_data[ind1], lev+1)


existing_nodes = {}
def build_graph_for_all():
    count=0
    for d in corr_data:
        if (count > 40) :
            return
        if  d[0] not in existing_edges :
             G.add_node(str(d[0]))
        if  d[1] not in existing_edges :     
             G.add_node(str(d[1]))
        G.add_edge(str(d[0]), str(d[1]))     
        count=count + 1


build_graph_for_all()

print (G.nodes(data=True))
plt.show()
nx.draw(G, width=2, with_labels=True)
plt.savefig("path5.png")

w="design"

G.add_node(w)

build_graph(w, 10)

print (G.nodes(data=True))
plt.show()
nx.draw(G, width=2, with_labels=True)
plt.savefig("path.png")


Data Visualization – Visualizing an LDA Model using Python

In the previous post Topic Extraction from Blog Posts with LSI , LDA and Python python code was created for text documents topic modeling using Latent Dirichlet allocation (LDA) method.
The output was just an overview of the words with corresponding probability distribution for each topic and it was hard to use the results. So in this post we will implement python code for LDA results visualization.

As before we will run LDA the same way from the same data input.

After LDA is done we get needed data for visualization using the following statement:


topicWordProbMat = ldamodel.print_topics(K)

Here is the example of output of topicWordProbMat (shown partially):

[(0, ‘0.016*”use” + 0.013*”extract” + 0.011*”web” + 0.011*”script” + 0.011*”can” + 0.010*”link” + 0.009*”comput” + 0.008*”intellig” + 0.008*”modul” + 0.007*”page”‘), (1, ‘0.037*”cloud” + 0.028*”tag” + 0.018*”number” + 0.015*”life” + 0.013*”path” + 0.012*”can” + 0.010*”word” + 0.008*”gener” + 0.007*”web” + 0.006*”born”‘), ……..

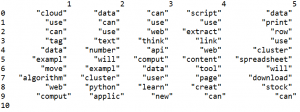
Using topicWordProbMat we will prepare matrix with the probabilities of words per each topic and per each word. We will prepare also dataframe and will output it in the table format, each column for topic, showing the words for each topic in the column. This is very useful to review results and decide if some words need to be removed. For example I see that I need remove some words like “will”, “use”, “can”.

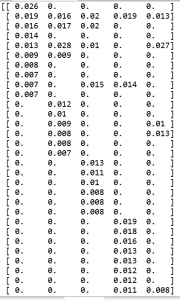
Below is the code for preparation of dataframe and matrix. The matrix zz is showing probability for each word and topic. Here we create empty dataframe df and then populate it element by element. Word Topic DataFrame is shown in the end of this post.


import pandas as pd
import numpy as np

columns = ['1','2','3','4','5']

df = pd.DataFrame(columns = columns)
pd.set_option('display.width', 1000)

# 40 will be resized later to match number of words in DC
zz = np.zeros(shape=(40,K))

last_number=0
DC={}

for x in range (10):
  data = pd.DataFrame({columns[0]:"",
                     columns[1]:"",
                     columns[2]:"",
                     columns[3]:"",
                     columns[4]:"",
                                                                                       
                     
                    },index=[0])
  df=df.append(data,ignore_index=True)  
    
for line in topicWordProbMat:
    
    tp, w = line
    probs=w.split("+")
    y=0
    for pr in probs:
               
        a=pr.split("*")
        df.iloc[y,tp] = a[1]
       
        if a[1] in DC:
           zz[DC[a[1]]][tp]=a[0]
        else:
           zz[last_number][tp]=a[0]
           DC[a[1]]=last_number
           last_number=last_number+1
        y=y+1

print (df)
print (zz)

The matrix zz will be used now for creating plot for visualization. Such plot can be called heatmap. Below is the code for this. The dark areas correspondent to 0 probability and the areas with less dark and more white correspondent to higher word probabilities for the given word and topic. Word topic map is shown in the end of this post.


import matplotlib.pyplot as plt

zz=np.resize(zz,(len(DC.keys()),zz.shape[1]))

for val, key in enumerate(DC.keys()):
        plt.text(-2.5, val + 0.5, key,
                 horizontalalignment='center',
                 verticalalignment='center'
                 )

plt.imshow(zz, cmap='hot', interpolation='nearest')
plt.show()

Below is the output from running python code.

Word Topic DataFrame


Word Topic Map


Matrix Data

Below is the full source code of the script.


# -*- coding: utf-8 -*-
     
import csv
from stop_words import get_stop_words
from nltk.stem.porter import PorterStemmer
from gensim import corpora
import gensim
import re
from nltk.tokenize import RegexpTokenizer

def remove_html_tags(text):
        """Remove html tags from a string"""
     
        clean = re.compile('<.*?>')
        return re.sub(clean, '', text)

tokenizer = RegexpTokenizer(r'\w+')

# use English stop words list
en_stop = get_stop_words('en')

# use p_stemmer of class PorterStemmer
p_stemmer = PorterStemmer()

fn="posts.csv" 
doc_set = []

with open(fn, encoding="utf8" ) as f:
            csv_f = csv.reader(f)
            for i, row in enumerate(csv_f):
               if i > 1 and len(row) > 1 :
                
                 temp=remove_html_tags(row[1]) 
                 temp = re.sub("[^a-zA-Z ]","", temp)
                 doc_set.append(temp)
              
texts = []

for i in doc_set:
    # clean and tokenize document string
    raw = i.lower()
    raw=' '.join(word for word in raw.split() if len(word)>2)    

    raw=raw.replace("nbsp", "")
    tokens = tokenizer.tokenize(raw)
   
    stopped_tokens = [i for i in tokens if not i in en_stop]
    stemmed_tokens = [p_stemmer.stem(i) for i in stopped_tokens]
    texts.append(stemmed_tokens)
# turn our tokenized documents into a id <-> term dictionary
dictionary = corpora.Dictionary(texts)
# convert tokenized documents into a document-term matrix
corpus = [dictionary.doc2bow(text) for text in texts]
ldamodel = gensim.models.ldamodel.LdaModel(corpus, num_topics=5, id2word = dictionary, passes=20)
print (ldamodel)
print(ldamodel.print_topics(num_topics=3, num_words=3))
for i in  ldamodel.show_topics(num_words=4):
    print (i[0], i[1])

# Get Per-topic word probability matrix:
K = ldamodel.num_topics
 
topicWordProbMat = ldamodel.print_topics(K)
print (topicWordProbMat) 
 
for t in texts:
     vec = dictionary.doc2bow(t)
     print (ldamodel[vec])

import pandas as pd
import numpy as np
columns = ['1','2','3','4','5']
df = pd.DataFrame(columns = columns)
pd.set_option('display.width', 1000)

# 40 will be resized later to match number of words in DC
zz = np.zeros(shape=(40,K))

last_number=0
DC={}

for x in range (10):
  data = pd.DataFrame({columns[0]:"",
                     columns[1]:"",
                     columns[2]:"",
                     columns[3]:"",
                     columns[4]:"",
                                                                                 
                   
                    },index=[0])
  df=df.append(data,ignore_index=True)  
   
for line in topicWordProbMat:

    tp, w = line
    probs=w.split("+")
    y=0
    for pr in probs:
               
        a=pr.split("*")
        df.iloc[y,tp] = a[1]
       
        if a[1] in DC:
           zz[DC[a[1]]][tp]=a[0]
        else:
           zz[last_number][tp]=a[0]
           DC[a[1]]=last_number
           last_number=last_number+1
        y=y+1
 
print (df)
print (zz)
import matplotlib.pyplot as plt
zz=np.resize(zz,(len(DC.keys()),zz.shape[1]))

for val, key in enumerate(DC.keys()):
        plt.text(-2.5, val + 0.5, key,
                 horizontalalignment='center',
                 verticalalignment='center'
                 )
plt.imshow(zz, cmap='hot', interpolation='nearest')
plt.show()


Topic Extraction from Blog Posts with LSI , LDA and Python

In the previous post we created python script to get posts from WordPress (WP) blog through WP API. This script was saving retrieved posts into csv file. In this post we will create script for topic extraction from the posts saved in this csv file. We will use the following 2 techniques (LSI and LDA) for topic modeling:

1. Latent semantic indexing (LSI) is an indexing and retrieval method that uses a mathematical technique called singular value decomposition (SVD) to identify patterns in the relationships between the terms and concepts contained in an unstructured collection of text. LSI is based on the principle that words that are used in the same contexts tend to have similar meanings. A key feature of LSI is its ability to extract the conceptual content of a body of text by establishing associations between those terms that occur in similar contexts.[1]

2. Latent Dirichlet allocation (LDA) is a generative statistical model that allows sets of observations to be explained by unobserved groups that explain why some parts of the data are similar. For example, if observations are words collected into documents, it posits that each document is a mixture of a small number of topics and that each word’s creation is attributable to one of the document’s topics. LDA is an example of a topic model. [2]

In one of the previous posts we looked how to use LDA with python. [8] So now we just applying this script to data in csv file with blog posts. Additionally we will use LSI method as alternative for topic modeling.

The script for LDA/LSA consists of the following parts:
1. As the first step the script is opens csv data file and load data to the memory. During this the script also performs some text preprocessing. As result of this we have the set of posts (documents).
2. The script iterates through set of posts and converts documents into tokens and saves all documents into texts. After iteration is completed the script builds dictionary and corpus.
3. In this step the script uses LSI model and LDA model.
4. Finally in the end for LDA method the script prints some information about topics, including document – topic information.

Comparing results of LSI and LDA methods it seems that LDA gives more understable topics.
Also LDA coefficients are all in range 0 – 1 as they indicate probabilities. This makes easy to explain results.

In our script we used LDA and LSI from gensim library, but there are another packages that allows to do LDA:
MALLET for example allows also to model a corpus of texts [4]
LDA – another python package for Latent Dirichlet Allocation [5]

There are also other techniques to do approximate topic modeling in Python. For example there is a technique called non-negative matrix factorization (NMF) that strongly resembles Latent Dirichlet Allocation [3] Also there is a probabilistic latent semantic analysis (PLSA), also known as probabilistic latent semantic indexing (PLSI) technique that evolved from LSA. [9]

In the future posts some of the above methods will be considered.

There is an interesting discussion on quora site how to run LDA and here you can find also some insights on how to prepare data and how to evaluate results of LDA. [6]

Here is the source code of script.


# -*- coding: utf-8 -*-

import csv
from stop_words import get_stop_words
from nltk.stem.porter import PorterStemmer
from gensim import corpora
import gensim

import re
from nltk.tokenize import RegexpTokenizer

M="LDA"

def remove_html_tags(text):
        """Remove html tags from a string"""
     
        clean = re.compile('<.*?>')
        return re.sub(clean, '', text)


tokenizer = RegexpTokenizer(r'\w+')

# use English stop words list
en_stop = get_stop_words('en')

# use p_stemmer of class PorterStemmer
p_stemmer = PorterStemmer()

fn="posts.csv" 
doc_set = []

with open(fn, encoding="utf8" ) as f:
            csv_f = csv.reader(f)
            for i, row in enumerate(csv_f):
               if i > 1 and len(row) > 1 :
                
                
                 temp=remove_html_tags(row[1]) 
                 temp = re.sub("[^a-zA-Z ]","", temp)
                 doc_set.append(temp)
                 
texts = []

for i in doc_set:
    print (i)
    # clean and tokenize document string
    raw = i.lower()
    raw=' '.join(word for word in raw.split() if len(word)>2)    
       
    raw=raw.replace("nbsp", "")
    tokens = tokenizer.tokenize(raw)
       
    stopped_tokens = [i for i in tokens if not i in en_stop]
    stemmed_tokens = [p_stemmer.stem(i) for i in stopped_tokens]
 
    texts.append(stemmed_tokens)

# turn our tokenized documents into a id <-> term dictionary
dictionary = corpora.Dictionary(texts)
# convert tokenized documents into a document-term matrix
corpus = [dictionary.doc2bow(text) for text in texts]

lsi = gensim.models.lsimodel.LsiModel(corpus, id2word=dictionary, num_topics=5  )
print (lsi.print_topics(num_topics=3, num_words=3))

for i in  lsi.show_topics(num_words=4):
    print (i[0], i[1])

if M=="LDA":
 ldamodel = gensim.models.ldamodel.LdaModel(corpus, num_topics=5, id2word = dictionary, passes=20)
 print (ldamodel)
 print(ldamodel.print_topics(num_topics=3, num_words=3))
 for i in  ldamodel.show_topics(num_words=4):
    print (i[0], i[1])

 # Get Per-topic word probability matrix:
 K = ldamodel.num_topics
 topicWordProbMat = ldamodel.print_topics(K)
 print (topicWordProbMat) 
 
 for t in texts:
     vec = dictionary.doc2bow(t)
     print (ldamodel[vec])

References
1. Latent_semantic_analysis
2. Latent_Dirichlet_allocation
3. Topic modeling in Python
4. Topic modeling with MALLET
5. Getting started with Latent Dirichlet Allocation in Python
6. What are good ways of evaluating the topics generated by running LDA on a corpus?
7. Working with text
8. Latent Dirichlet Allocation (LDA) with Python Script
9. Probabilistic latent semantic analysis