Introduction
Large volumes of hydrocarbons remain to be found in the world. Finding and extracting these hydrocarbons is difficult and expensive. We believe that under-utilization of data, and of the existing subsurface knowledge base, are at least partly responsible for the disappointing exploration performance. Furthermore, we argue that the incredibly rich subsurface dataset available can be used much more efficiently to deliver much more precise predictions, and to thus support more profitable investment decisions during hydrocarbon exploration and production.
In this section we will argue that Artificial Intelligence (AI), i.e. Machine Learning-based technology, which leverages algorithms that can learn and make predictions directly from data, represents one way to contribute to exploration and production success. One key advantage of AI is the technology’s ability to efficiently handle very large volumes of multidimensional data, thus saving time and cost and, therefore, allowing human resources to be deployed to other, perhaps more creative tasks. Another advantage is AI or Machine Learning applications is ability to detect complex, multidimensional patterns that are not readily detectable by humans.
We will show in detail how Deep Neural Networks can automate a process in seismic velocity analysis, which usually take days to be done manually. Firstly there will be a brief section describing the process of velocity analysis, then we will move on and integrate the process with Neural Networks and Deep Learning.
Seismic Velocity Analysis
Understanding of the subsurface velocities are very important as they are indicators or various features and also the presence of hydrocarbons or not. With the understanding for the subsurface features we can interpret the traps where hydrocarbon or gases maybe be present.
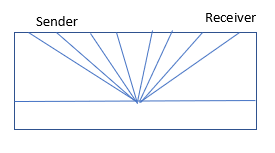
A seismic source and a receiver is kept on a surface. Source produce a wave which penetrates the earth and gets reflected or refracted at several boundaries under the surface and are recorded back by the receiver on the surface. The data that we collect have information of the subsurface structural variations and we then use various methods to interpret them. Seismic Velocity Analysis is a process of getting subsurface velocities at different depths using the data that we just collected.
We will be using Semblance Curves to get the stacking velocities from the Seismic Section. Semblance peaks are picked using Neural Network trained on previously handpicked data.
Semblance Curves
Semblance analysis is a process used in the refinement and study of seismic data. The use of this technique along with other methods makes it possible to greatly increase the resolution of the data despite the presence of background noise. This new data is usually easier to interpret when trying to deduce the underground structure of an area.
Semblance Curve has velocity at its horizontal axis and time at its vertical axis. What our goal is to get a maximum value for each time unit in vertical axis. The values in the curve range from 0 to 1. Theoretically there can be just one maximum value at a time unit but in practice due to noise in our data we get bands with many maximums. It becomes hard to interpret which value is the correct velocity value, so we have to try out each value and see which one flattens our Seismic traces the best. It is a very tedious job to manually pick the value, so here we have trained a neural network which will automatically pick the maximum in each time unit.
Generating Semblance Curves
Semblance Curves were generated using an open source software called Madagascar. The data that we used is also available open source and is the data from Viking Graben Region. You can check the instructions on how to generate Semblance Curves by looking at instructions provided at Madagascar official website. Madagascar comes with an API for attaching the code written in software to any custom build program in many languages. In our case, we will attach this with our tensorflow neural network written in python.
Deep Neural Network
The data that creates the semblance curve is put into numpy array. We have a set of hand picked peaks for our training data set.
We created a simple Multi Layer perceptron with 4 hidden layers and used Adam optimization algorithm to fit the parameters by learning from the hand picked values for our data set. For this we utilized tensorflow functions as below:
optimizer=tf.train.AdamOptimizer(learning_rate=learning_rate).minimize(cost)
The data set has 2400 CMP gathers and 1500 time units in each CMP gather. A gather is a collection of seismic traces that have some common geometric attribute. In our case we use common mid-point (CMP) gather (See Figure below).

The data is huge and it took 15 hours to train and after training the parameters were tested on Nankai dataset (Comes with madagascar software), it gave the output in 10 minutes and achieved an accuracy of 85.67%.
To get python source code, click this link to deep neural network code
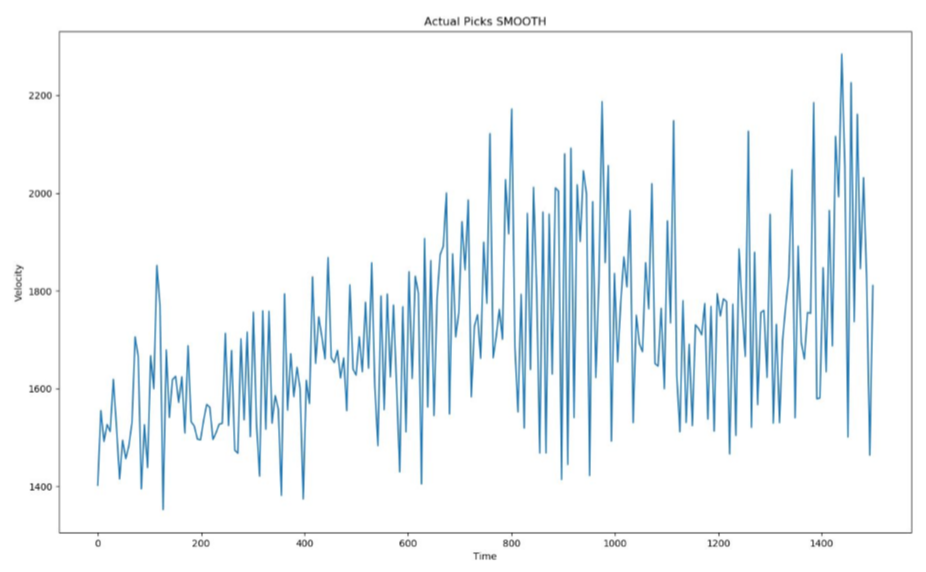
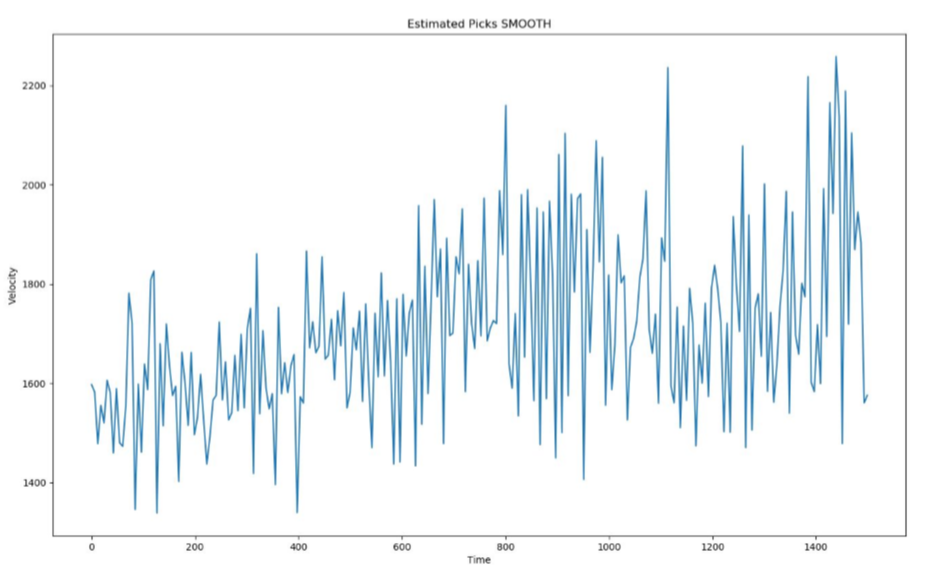
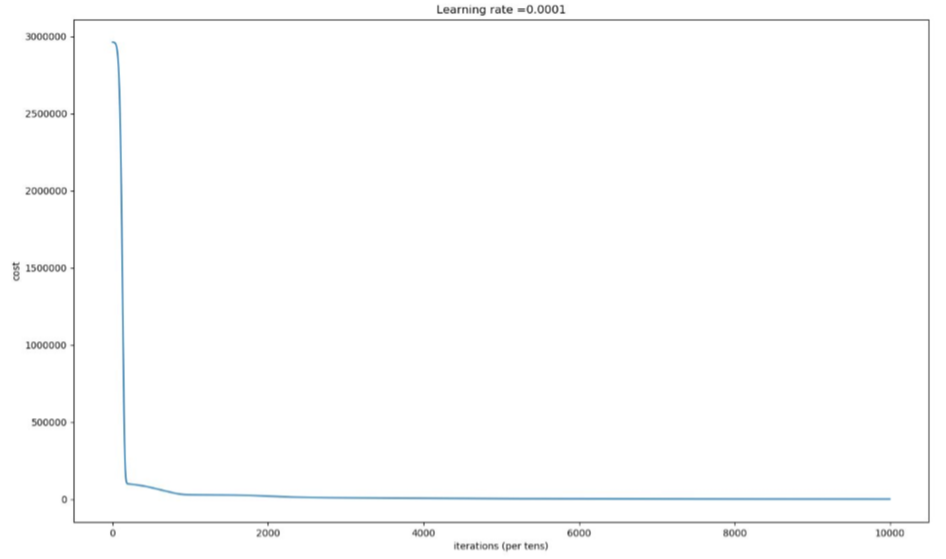
Following are the graphs for Actual Velocities of the region recorded then the velocities estimated by the Neural Network and lastly the learning curve of our neural net.


Conclusion
We can see from the graphs above that Estimated velocities are very close to the actual velocities. Training a neural network takes hours but once trained it reproduces results in minutes. This method saves days of manually picking the peaks which will give us the velocity hence speeding up the process.
References
1. VG Data Madagascar
2. Link to data from Viking Graben Region
3. Gather
4. Neural Networks – Applications Seismic Prospecting Neural Network Code
You must be logged in to post a comment.