Bokeh is a Python library for building advanced and modern data visualization web applications. Bokeh allows to add interactive controls like slider, buttons, dropdown menu and so on to the data graphs. Bokeh provides a variety of ways to embed plots and data into HTML documents including generating standalone HTML documents. [6]
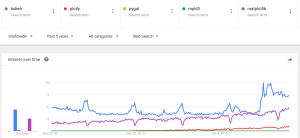
There is a sharp increase of popularity for Bokeh data visualization libraries (Fig 1), reflecting the increased interest in machine learning and data science over the last few years.

In this post we put together 4 most common examples of data plots using Bokeh. The examples include such popular controls like slider, button. They use loading data from data files which is common situation in practice. The examples show how to add create plot and how to add interactivity using Bokeh and will help to make quick start in using Bokeh.
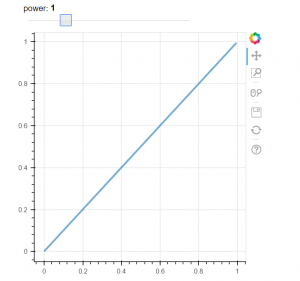
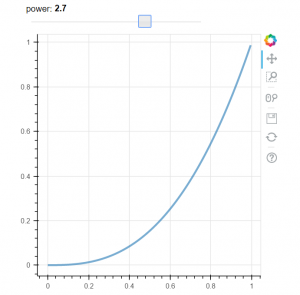
Our first example demonstrates how to add interactivity with slide control. This example is taken from Bokeh documentation [4]. When we change the slider value the line is changing its properties. See Fig 2 for example how the plot is changing. The example is using callbak function attached to slider control.
# -*- coding: utf-8 -*-

from bokeh.layouts import column
from bokeh.models import CustomJS, ColumnDataSource, Slider
from bokeh.plotting import Figure, output_file, show

# fetch and clear the document
from bokeh.io import curdoc
curdoc().clear()

output_file("callback.html")

x = [x*0.005 for x in range(0, 200)]
y = x

source = ColumnDataSource(data=dict(x=x, y=y))

plot = Figure(plot_width=400, plot_height=400)
plot.line('x', 'y', source=source, line_width=3, line_alpha=0.6)

def callback(source=source, window=None):
    data = source.data
    f = cb_obj.value
    x, y = data['x'], data['y']
    for i in range(len(x)):
        y[i] = window.Math.pow(x[i], f)
    source.trigger('change')

slider = Slider(start=0.1, end=4, value=1, step=.1, title="power",
                callback=CustomJS.from_py_func(callback))

layout = column(slider, plot)

show(layout)
Alternatively we can attach callback through the js_on_change method of Bokeh slider model:
callback = CustomJS(args=dict(source=source), code="""
    var data = source.data;
    var f = cb_obj.value
    x = data['x']
    y = data['y']
    for (i = 0; i < x.length; i++) {
        y[i] = Math.pow(x[i], f)
    }
    source.trigger('change');
""")

slider = Slider(start=0.1, end=4, value=1, step=.1, title="power")
slider.js_on_change('value', callback)


Our second example shows how to use button control. In this example we use Button on_click method to change graph.
# -*- coding: utf-8 -*-

from bokeh.layouts import column
from bokeh.models import CustomJS, ColumnDataSource
from bokeh.plotting import Figure, output_file, show

from bokeh.io import curdoc
curdoc().clear()

from bokeh.models.widgets import Button
output_file("button.html")


x = [x*0.05 for x in range(0, 200)]
y = x

source = ColumnDataSource(data=dict(x=x, y=y))

plot = Figure(plot_width=400, plot_height=400)
plot.line('x', 'y', source=source, line_width=3, line_alpha=0.6)

callback = CustomJS(args=dict(source=source), code="""
    var data = source.data;
    x = data['x']
    y = data['y']
    for (i = 0; i < x.length; i++) {
        y[i] = Math.pow(x[i], 4)
    }
    source.trigger('change');
""")


toggle1 = Button(label="Change Graph", callback=callback, name="1")
layout = column(toggle1 , plot)

show(layout)
Our 3rd example demonstrates how to load data from csv data file. This example is borrowed from stackoverflow [5] In this example we also use button, but here we load data from file to dataframe. We use two buttons, two files and 2 dataframes, the buttons allow to switch between data files and reload the graph.
# -*- coding: utf-8 -*-
from bokeh.io import vplot
import pandas as pd
from bokeh.models import CustomJS, ColumnDataSource
from bokeh.models.widgets import Button
from bokeh.plotting import figure, output_file, show

output_file("load_data_buttons.html")

df1 = pd.read_csv("data_file_1.csv")
df2 = pd.read_csv("data_file_2.csv")

df1.columns = df1.columns.str.strip()
df2.columns = df2.columns.str.strip()
plot = figure(plot_width=400, plot_height=400, title="xxx")
source = ColumnDataSource(data=dict(x=[0, 1], y=[0, 1]))
source2 = ColumnDataSource(data=dict(x1=df1.x.values, y1=df1.y.values,
                                    x2=df2.x.values, y2=df2.y.values))

plot.line('x', 'y', source=source, line_width=3, line_alpha=0.6)

callback = CustomJS(args=dict(source=source, source2=source2), code="""
        var data = source.get('data');
        var data2 = source2.get('data');
        data['x'] = data2['x' + cb_obj.get("name")];
        data['y'] = data2['y' + cb_obj.get("name")];
        source.trigger('change');
    """)

toggle1 = Button(label="Load data file 1", callback=callback, name="1")
toggle2 = Button(label="Load data file 2", callback=callback, name="2")

layout = vplot(toggle1, toggle2, plot)

show(layout)
As mentioned on the web, Interactive data visualizations turn plots into powerful interfaces for data exploration. [7] The shown above examples demonstrate how to make the graph data interactive and hope will help to make quick start in this direction.
References
1. 5 Python Libraries for Creating Interactive Plots
2. 10 Useful Python Data Visualization Libraries for Any Discipline
3. The Most Popular Language For Machine Learning and Data Science
4. Welcome to Bokeh
5. Load graph data from files on button click with bokeh
6. Embedding Plots and Apps
7. How effective data visualizations let users have a conversation with data


You must be logged in to post a comment.