Python is widely used programming language in many fields, such as data science, machine learning, web development. It is also a great choice for automation of different computer tasks such as data downloading from websites or data manipulation. Python can open, read or save data in different file formats.
In this post we will look how to use python for extracting data from different CSV files and saving the data in some archive file. This is a typical task that can appear when you download data from one or more websites into different files and then need to combine and save the data in some location that can be database or archive file.
The so-called CSV (Comma Separated Values) format is the most common import and export format for spreadsheets and databases. There is no “CSV standard”, so the format is operationally defined by the many applications which read and write it. [1]
In our sample script the python program goes through specified folder and finds all CSV files.
The CSV file then is opened and needed data is selected. Here we skip first five header rows.
The selected data is then saved in one master.
Here is the full source script.
import os
import csv

## utf8 was used to support international characters
## newline=''  was used because otherwise it will put blank line between lines
## F1, F2 - just field names
## path is the path folders where CSV files with the data are located

with open('data.csv', 'w', encoding="utf8", newline='' ) as csvfile:
  fieldnames = ['F1', 'F2']
  writer = csv.DictWriter(csvfile, fieldnames=fieldnames)
  writer.writeheader()


  path="C:\\Users\\Owner\\Downloads"
  list_of_files = {}
  for filename in os.listdir(path):
     # if the element is an CSV file then...
     if filename[-4:] == ".csv":
         list_of_files[filename] = path + "\\" + filename
         print   (list_of_files[filename])
         with open(list_of_files[filename], encoding="utf8" ) as f:
            csv_f = csv.reader(f)
            for i, row in enumerate(csv_f):
               if i > 5 and len(row) > 1 :
                 print(row)
                 writer.writerow({'F1': row[0], 'F2': row[1]})
In case you want save combined data in database for example MongoDB here is the script source code. The script is using MongoDB in the cloud at MongoLab. Refer to [2] if you need to install MongoDB on windows system
import os
import csv
from pymongo import MongoClient


#To connect using the MongoDB on MongoLab via the standard MongoDB URI:
#mongodb://:@xxxxxxx.mlab.com:xxxxx/database_name
# to learn more about MongoLab visit http://www.mongolab.com     [3]
# insert your data in the line below for your MongoLab connection string data

connection = MongoClient("mongodb://user_name:password@xxx.mlab.com:xxx/database_name")

# insert your data for database_name and collection_name
db = connection.database_name.collection_name


path="C:\\Users\\Owner\\Downloads"
list_of_files = {}
for filename in os.listdir(path):
     # if the element is a csv file then..
     if filename[-4:] == ".csv":
         list_of_files[filename] = path + "\\" + filename
         print   (list_of_files[filename])
         with open(list_of_files[filename], encoding="utf8" ) as f:
            csv_f = csv.reader(f)
            for i, row in enumerate(csv_f):
               if i > 5 and len(row) > 1 :
                 print(row)
                 db.insert({'F1': row[0], 'F2': row[1]})

# find all documents
results = db.find()

print()
print('==============================')

# display documents from collection
for record in results:
   # print out the document
   print(record['F1'] + ',',record['F2'])

print()

# close the connection to MongoDB
connection.close()
The scripts above can be easy customized for your specific needs. Feel free to ask questions or provide any feedback or comments. Below you can find references and useful links.
Motivation
Optimization problem studies maximizing or minimizing some function y=f(x) with some range of choices available for x. Biologically inspired (bio-inspired) algorithms for optimization problems are now widely used. A few examples of such optimization are:
particle swarm optimization (PSO) that is based on the swarming behavior of fish and birds,
firefly algorithm (FA) that is based on the flashing behavior of swarming fireflies,
ant colony optimization (ACO) that is based on the interaction of social insects (e.g., ants)
bee algorithms are all based on the foraging behavior of honey bees. [1]
Recently on different forums there were questions how this optimization technique can be applied to text mining tasks such as classification or clustering. Those problems usually use algorithms that come from data mining or machine learning fields such as k-means clustering, SVM (support vector machine), naive Bayes.
How can we apply bio-inspired algorithms for clustering?
Let’s take a python package inspyred which has many bio-inspired algorithms including evolutionary computation, swarm intelligence, and immunocomputing [2]. This package has examples for specific predetermined functions that are used as benchmarks.
However the code also can be customized to run for user defined functions.
Below is the example of customized code for finding minimum of function f(x)=(x-1)**2, in this code function evaluate was added to specify how we calculate fitness. In this example we use PSO algorithm.
We run this code and we get what we expected to get. Below you can find also the final output of the program.
So now we understand what we need to change to fit optimization to different problems. Specifically we need to modify fitness function. Additionally we need to modify range and observer.
In the next post Bio-Inspired Optimization for Text Mining-2 Numerical One Dimensional Example we will continue to modify source code for solving clustering problem.
# f(x)=(x-1)**2 minimize  on 0...2
## http://pythonhosted.org/inspyred/examples.html#ant-colony-optimization
## https://aarongarrett.github.io/inspyred/reference.html#benchmarks-benchmark-optimization-functions

from time import time
from random import Random
import inspyred

def my_observer(population, num_generations, num_evaluations, args):
    best = max(population)
    print('{0:6} -- {1} : {2}'.format(num_generations,
                                      best.fitness,
                                      str(best.candidate)))


def generate(random, args):
     return [random.uniform(0, 2)]

def evaluate(candidates, args):
     fitness = []
     for cand in candidates:
          fit = [(c-1)**2 for c in cand]
          fitness.append(fit)
     return fitness


def main(prng=None, display=False):
    if prng is None:
        prng = Random()
        prng.seed(time())


    ea = inspyred.swarm.PSO(prng)
    ea.observer = my_observer
    ea.terminator = inspyred.ec.terminators.evaluation_termination
    ea.topology = inspyred.swarm.topologies.ring_topology
    final_pop = ea.evolve(generator=generate,
                          evaluator=evaluate,
                          pop_size=100,
                          bounder=inspyred.ec.Bounder(0, 2),
                          maximize=False,
                          max_evaluations=30000,
                          neighborhood_size=2)

    if display:
        best = max(final_pop)
        print('Best Solution: \n{0}'.format(str(best)))
    return ea

if __name__ == '__main__':
    main(display=True)
In the previous posts [1],[2] perl was used to get content from the web through Faroo API and Guardian APIs. In this post PHP and Pyhton will be used to get web data using same APIs.
PHP has a powerful JSON parsing mechanism, which, because PHP is a dynamic language, enables PHP developers to program against a JSON object graph in a very straightforward way. [3] In the PHP example code shown here we do not need any additional library or module in PHP script while Perl code required some modules such as LWP, HTTP, JSON.
Below is PHP code example to make API call to search function and display web title and link for returned results. You can also see online running example of PHP API script
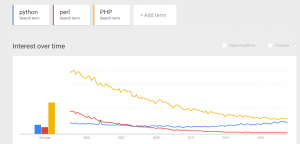
Python is a widely used powerful programming language. It’s extremely popular in data science, machine learning and bioinformatics. Many websites are built around the Django Python framework. Below is the comparison of trends over the 10+ years for Python, PHP and Perl. Trend for Python, Perl, PHP
Data Source: Google Trends (www.google.com/trends).”
And here is the python code to make API call and display data for returned results. The example was developed and tested on Anaconda/Spider(Python 3.5) environment.
import requests


resp=requests.get("http://www.faroo.com/api?q=analytics&start=1&l=en&src=web&f=json&key=xxxx&jsoncallback=?")
if resp.status_code != 200:
  print ("Something went wrong")
  exit();

message=resp.json().get('results')
# to see in plain text all results enable next line
# print (message)
print ("\n\n\n")
for item in message:
        #to see everything related to item enable next line
        #print (item)
        print (item['url'])
        print (item['title'])
        print (item['kwic'])
        print ("\n\n")
In one of previous post the Faroo API was used in order to get data content from the web. In this post we will look at different API that can be also used for downloading content from web. Here we will use the Guardian API / open platform.
At the time of writing at stated on website it has over 1.7 million pieces of content that can be used to build apps. This is the great opportunity to supplement your articles with related Guardian content. And we will look how to do this.
Specifically the perl script will be used for getting web search results with Guardian API. The following are the main steps in this perl script: Connecting to Gurdian API
In this step we provide our API key and parameters to search function with the search terms string.
use LWP::UserAgent;
use HTTP::Request::Common qw{ POST };
my $ua = LWP::UserAgent->new;
my $server_endpoint = "http://content.guardianapis.com/search";
$server_endpoint=$server_endpoint."?q=$q&format=json&api-key=xxxxxxxx&page-size=10&page=$page";
my $req = HTTP::Request->new(GET => $server_endpoint);
Getting the Search Results and Decoding json data
In this step we decode json text that we got returned from our call to web search function.
use JSON qw( decode_json );
$resp = $ua->request($req);
if ($resp->is_success) {
        my $message = decode_json($resp->content);
###if we want to print to look at raw data:
###print $resp->content;
}
Displaying data
Now we are displaying data
use JSON qw( decode_json );

$items_N=10;
for ($i=0; $i<$items_N; $i++)
{

print  $message->{response}->{results}->[$i]->{webTitle};
print  $message->{response}->{results}->[$i]->{webUrl};
}
Conclusion
Thus we looked at how to connect to The Guardian API , how to get data returned by this API service, how to process json data and how to display data to user.
If your website is showing some content then it can be complemented by content returned from The Guardian API.
Feel free to ask questions, suggestions, modifications.
In one of the previous post http://intelligentonlinetools.com/blog/2016/05/28/using-python-for-mining-data-from-twitter/ python source code for mining Twitter data was implemented. Clustering was applied to put tweets in different groups using bag of words representation for the text. The results of clustering were obtained via numerical matrix. Now we will look at visualization of clustering results using python. Also we will do some additional data cleaning before clustering.
Data preprocessing
The following actions are added before clustering :
Retweet tweets always start with text in the form “RT @name: “. The code is added to remove this text.
Special characters like #, ! are removed.
URL links are removed.
All numerical numbers also removed.
Duplicates tweets retweets are removed – we keep only one tweet
Below is the code for the above preprocessing steps. See full source code for functions right, remove_duplicates.
for counter, t in enumerate(texts):
    if t.startswith("rt @"):
          pos= t.find(": ")
          texts[counter] = right(t, len(t) - (pos+2))

for counter, t in enumerate(texts):
    texts[counter] = re.sub(r'[?|$|.|!|#|\-|"|\n|,|@|(|)]',r'',texts[counter])
    texts[counter] = re.sub(r'https?:\/\/.*[\r\n]*', '', texts[counter], flags=re.MULTILINE)
    texts[counter] = re.sub(r'[0|1|2|3|4|5|6|7|8|9|:]',r'',texts[counter])
    texts[counter] = re.sub(r'deeplearning',r'deep learning',texts[counter])

texts= remove_duplicates(texts)
Plotting
The vector-space models as a choosen model for representing word meanings in this example is the problem in multidimensional space. The number of different words is high even for small set of data. There is however a tool t-SNE to visualize high-dimensional data. It converts similarities between data points to joint probabilities and tries to minimize the Kullback-Leibler divergence between the joint probabilities of the low-dimensional embedding and the high-dimensional data. t-SNE has a cost function that is not convex, i.e. with different initializations we can get different results. [1] Below is the python source code for building plot for visualization of clustering results.
from sklearn.manifold import TSNE

model = TSNE(n_components=2, random_state=0)
np.set_printoptions(suppress=True)
Y=model.fit_transform(train_data_features)

plt.scatter(Y[:, 0], Y[:, 1], c=clustering_result, s=290,alpha=.5)
plt.show()
The resulting visualization is shown below Data Visualization for Clustering Results
Analysis
Additionally to visualization the silhouette_score was computed and the obtained value was around 0.2
The silhouette_score gives the average value for all the samples. This gives a perspective into the density and separation of the formed clusters.
Silhoette coefficients (as these values are referred to as) near +1 indicate that the sample is far away from the neighboring clusters. A value of 0 indicates that the sample is on or very close to the decision boundary between two neighboring clusters and negative values indicate that those samples might have been assigned to the wrong cluster. [2]
Thus in this post python script for visualization of clustering results was provided. The clustering was applied to results of Twitter search for some specific phrase.
It should be noted that clustering of tweets data is challenging as the tweet length can be only 140 characters or less. Such problems are related to short text clustering and there are some additional technique that can be applied to get better results. [3]-[6]
Below is the full script code.
import twitter
import json

import matplotlib.pyplot as plt
import numpy as np

from sklearn.feature_extraction.text import CountVectorizer
from sklearn.cluster import Birch
from sklearn.manifold import TSNE

import re

from sklearn.metrics import silhouette_score

# below function is from
# http://www.dotnetperls.com/duplicates-python
def remove_duplicates(values):
    output = []
    seen = set()
    for value in values:
        # If value has not been encountered yet,
        # ... add it to both list and set.
        if value not in seen:
            output.append(value)
            seen.add(value)
    return output

# below 2 functions are from
# http://stackoverflow.com/questions/22586286/
#         python-is-there-an-equivalent-of-mid-right-and-left-from-basic
def left(s, amount = 1, substring = ""):
    if (substring == ""):
        return s[:amount]
    else:
        if (len(substring) > amount):
            substring = substring[:amount]
        return substring + s[:-amount]

def right(s, amount = 1, substring = ""):
    if (substring == ""):
        return s[-amount:]
    else:
        if (len(substring) > amount):
            substring = substring[:amount]
        return s[:-amount] + substring


CONSUMER_KEY ="xxxxxxx"
CONSUMER_SECRET ="xxxxxxx"
OAUTH_TOKEN = "xxxxxx"
OAUTH_TOKEN_SECRET = "xxxxxx"


auth = twitter.oauth.OAuth (OAUTH_TOKEN, OAUTH_TOKEN_SECRET, CONSUMER_KEY, CONSUMER_SECRET)

twitter_api= twitter.Twitter(auth=auth)
q='#deep learning'
count=100

# Do search for tweets containing '#deep learning'
search_results = twitter_api.search.tweets (q=q, count=count)

statuses=search_results['statuses']

# Iterate through 5 more batches of results by following the cursor
for _ in range(5):
   print ("Length of statuses", len(statuses))
   try:
        next_results = search_results['search_metadata']['next_results']
   except KeyError:
       break
   # Create a dictionary from next_results
   kwargs=dict( [kv.split('=') for kv in next_results[1:].split("&") ])

   search_results = twitter_api.search.tweets(**kwargs)
   statuses += search_results['statuses']

# Show one sample search result by slicing the list
print (json.dumps(statuses[0], indent=10))


# Extracting data such as hashtags, urls, texts and created at date
hashtags = [ hashtag['text'].lower()
    for status in statuses
       for hashtag in status['entities']['hashtags'] ]


urls = [ urls['url']
    for status in statuses
       for urls in status['entities']['urls'] ]


texts = [ status['text'].lower()
    for status in statuses
        ]

created_ats = [ status['created_at']
    for status in statuses
        ]

# Preparing data for trending in the format: date word
i=0
print ("===============================\n")
for x in created_ats:
     for w in texts[i].split(" "):
        if len(w)>=2:
              print (x[4:10], x[26:31] ," ", w)
     i=i+1

# Prepare tweets data for clustering
# Converting text data into bag of words model

vectorizer = CountVectorizer(analyzer = "word", \
                             tokenizer = None,  \
                             preprocessor = None,  \
                             stop_words='english', \
                             max_features = 5000)


for counter, t in enumerate(texts):
    if t.startswith("rt @"):
          pos= t.find(": ")
          texts[counter] = right(t, len(t) - (pos+2))

for counter, t in enumerate(texts):
    texts[counter] = re.sub(r'[?|$|.|!|#|\-|"|\n|,|@|(|)]',r'',texts[counter])
    texts[counter] = re.sub(r'https?:\/\/.*[\r\n]*', '', texts[counter], flags=re.MULTILINE)
    texts[counter] = re.sub(r'[0|1|2|3|4|5|6|7|8|9|:]',r'',texts[counter])
    texts[counter] = re.sub(r'deeplearning',r'deep learning',texts[counter])

texts= remove_duplicates(texts)

train_data_features = vectorizer.fit_transform(texts)
train_data_features = train_data_features.toarray()

print (train_data_features.shape)
print (train_data_features)

vocab = vectorizer.get_feature_names()
print (vocab)

dist = np.sum(train_data_features, axis=0)

# For each, print the vocabulary word and the number of times it
# appears in the training set
for tag, count in zip(vocab, dist):
    print (count, tag)


# Clustering data
n_clusters=7
brc = Birch(branching_factor=50, n_clusters=n_clusters, threshold=0.5,  compute_labels=True)
brc.fit(train_data_features)

clustering_result=brc.predict(train_data_features)
print ("\nClustering_result:\n")
print (clustering_result)

# Outputting some data
print (json.dumps(hashtags[0:50], indent=1))
print (json.dumps(urls[0:50], indent=1))
print (json.dumps(texts[0:50], indent=1))
print (json.dumps(created_ats[0:50], indent=1))


with open("data.txt", "a") as myfile:
     for w in hashtags:
           myfile.write(str(w.encode('ascii', 'ignore')))
           myfile.write("\n")


# count of word frequencies
wordcounts = {}
for term in hashtags:
    wordcounts[term] = wordcounts.get(term, 0) + 1


items = [(v, k) for k, v in wordcounts.items()]
print (len(items))

xnum=[i for i in range(len(items))]
for count, word in sorted(items, reverse=True):
    print("%5d %s" % (count, word))


for x in created_ats:
  print (x)
  print (x[4:10])
  print (x[26:31])
  print (x[4:7])


plt.figure(1)
plt.title("Frequency of Hashtags")

myarray = np.array(sorted(items, reverse=True))

plt.xticks(xnum, myarray[:,1],rotation='vertical')
plt.plot (xnum, myarray[:,0])
plt.show()


model = TSNE(n_components=2, random_state=0)
np.set_printoptions(suppress=True)
Y=model.fit_transform(train_data_features)
print (Y)


plt.figure(2)
plt.scatter(Y[:, 0], Y[:, 1], c=clustering_result, s=290,alpha=.5)

for j in range(len(texts)):
   plt.annotate(clustering_result[j],xy=(Y[j][0], Y[j][1]),xytext=(0,0),textcoords='offset points')
   print ("%s %s" % (clustering_result[j],  texts[j]))

plt.show()

silhouette_avg = silhouette_score(train_data_features, clustering_result)
print("For n_clusters =", n_clusters, "The average silhouette_score is :", silhouette_avg)


You must be logged in to post a comment.