In the previous post Topic Extraction from Blog Posts with LSI , LDA and Python python code was created for text documents topic modeling using Latent Dirichlet allocation (LDA) method.
The output was just an overview of the words with corresponding probability distribution for each topic and it was hard to use the results. So in this post we will implement python code for LDA results visualization.
As before we will run LDA the same way from the same data input.
After LDA is done we get needed data for visualization using the following statement:
topicWordProbMat = ldamodel.print_topics(K)
Here is the example of output of topicWordProbMat (shown partially):
[(0, ‘0.016*”use” + 0.013*”extract” + 0.011*”web” + 0.011*”script” + 0.011*”can” + 0.010*”link” + 0.009*”comput” + 0.008*”intellig” + 0.008*”modul” + 0.007*”page”‘), (1, ‘0.037*”cloud” + 0.028*”tag” + 0.018*”number” + 0.015*”life” + 0.013*”path” + 0.012*”can” + 0.010*”word” + 0.008*”gener” + 0.007*”web” + 0.006*”born”‘), ……..
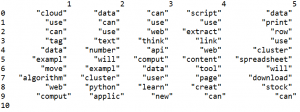
Using topicWordProbMat we will prepare matrix with the probabilities of words per each topic and per each word. We will prepare also dataframe and will output it in the table format, each column for topic, showing the words for each topic in the column. This is very useful to review results and decide if some words need to be removed. For example I see that I need remove some words like “will”, “use”, “can”.
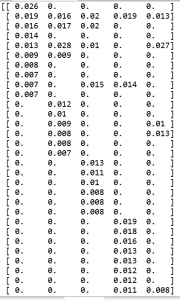
Below is the code for preparation of dataframe and matrix. The matrix zz is showing probability for each word and topic. Here we create empty dataframe df and then populate it element by element. Word Topic DataFrame is shown in the end of this post.
import pandas as pd
import numpy as np

columns = ['1','2','3','4','5']

df = pd.DataFrame(columns = columns)
pd.set_option('display.width', 1000)

# 40 will be resized later to match number of words in DC
zz = np.zeros(shape=(40,K))

last_number=0
DC={}

for x in range (10):
  data = pd.DataFrame({columns[0]:"",
                     columns[1]:"",
                     columns[2]:"",
                     columns[3]:"",
                     columns[4]:"",


                    },index=[0])
  df=df.append(data,ignore_index=True)

for line in topicWordProbMat:

    tp, w = line
    probs=w.split("+")
    y=0
    for pr in probs:

        a=pr.split("*")
        df.iloc[y,tp] = a[1]

        if a[1] in DC:
           zz[DC[a[1]]][tp]=a[0]
        else:
           zz[last_number][tp]=a[0]
           DC[a[1]]=last_number
           last_number=last_number+1
        y=y+1

print (df)
print (zz)
The matrix zz will be used now for creating plot for visualization. Such plot can be called heatmap. Below is the code for this. The dark areas correspondent to 0 probability and the areas with less dark and more white correspondent to higher word probabilities for the given word and topic. Word topic map is shown in the end of this post.
import matplotlib.pyplot as plt

zz=np.resize(zz,(len(DC.keys()),zz.shape[1]))

for val, key in enumerate(DC.keys()):
        plt.text(-2.5, val + 0.5, key,
                 horizontalalignment='center',
                 verticalalignment='center'
                 )

plt.imshow(zz, cmap='hot', interpolation='nearest')
plt.show()
Below is the output from running python code.

Word Topic DataFrame

Word Topic Map

Matrix Data
Below is the full source code of the script.
# -*- coding: utf-8 -*-

import csv
from stop_words import get_stop_words
from nltk.stem.porter import PorterStemmer
from gensim import corpora
import gensim
import re
from nltk.tokenize import RegexpTokenizer

def remove_html_tags(text):
        """Remove html tags from a string"""

        clean = re.compile('<.*?>')
        return re.sub(clean, '', text)

tokenizer = RegexpTokenizer(r'\w+')

# use English stop words list
en_stop = get_stop_words('en')

# use p_stemmer of class PorterStemmer
p_stemmer = PorterStemmer()

fn="posts.csv"
doc_set = []

with open(fn, encoding="utf8" ) as f:
            csv_f = csv.reader(f)
            for i, row in enumerate(csv_f):
               if i > 1 and len(row) > 1 :

                 temp=remove_html_tags(row[1])
                 temp = re.sub("[^a-zA-Z ]","", temp)
                 doc_set.append(temp)

texts = []

for i in doc_set:
    # clean and tokenize document string
    raw = i.lower()
    raw=' '.join(word for word in raw.split() if len(word)>2)

    raw=raw.replace("nbsp", "")
    tokens = tokenizer.tokenize(raw)

    stopped_tokens = [i for i in tokens if not i in en_stop]
    stemmed_tokens = [p_stemmer.stem(i) for i in stopped_tokens]
    texts.append(stemmed_tokens)
# turn our tokenized documents into a id <-> term dictionary
dictionary = corpora.Dictionary(texts)
# convert tokenized documents into a document-term matrix
corpus = [dictionary.doc2bow(text) for text in texts]
ldamodel = gensim.models.ldamodel.LdaModel(corpus, num_topics=5, id2word = dictionary, passes=20)
print (ldamodel)
print(ldamodel.print_topics(num_topics=3, num_words=3))
for i in  ldamodel.show_topics(num_words=4):
    print (i[0], i[1])

# Get Per-topic word probability matrix:
K = ldamodel.num_topics

topicWordProbMat = ldamodel.print_topics(K)
print (topicWordProbMat)

for t in texts:
     vec = dictionary.doc2bow(t)
     print (ldamodel[vec])

import pandas as pd
import numpy as np
columns = ['1','2','3','4','5']
df = pd.DataFrame(columns = columns)
pd.set_option('display.width', 1000)

# 40 will be resized later to match number of words in DC
zz = np.zeros(shape=(40,K))

last_number=0
DC={}

for x in range (10):
  data = pd.DataFrame({columns[0]:"",
                     columns[1]:"",
                     columns[2]:"",
                     columns[3]:"",
                     columns[4]:"",


                    },index=[0])
  df=df.append(data,ignore_index=True)

for line in topicWordProbMat:

    tp, w = line
    probs=w.split("+")
    y=0
    for pr in probs:

        a=pr.split("*")
        df.iloc[y,tp] = a[1]

        if a[1] in DC:
           zz[DC[a[1]]][tp]=a[0]
        else:
           zz[last_number][tp]=a[0]
           DC[a[1]]=last_number
           last_number=last_number+1
        y=y+1

print (df)
print (zz)
import matplotlib.pyplot as plt
zz=np.resize(zz,(len(DC.keys()),zz.shape[1]))

for val, key in enumerate(DC.keys()):
        plt.text(-2.5, val + 0.5, key,
                 horizontalalignment='center',
                 verticalalignment='center'
                 )
plt.imshow(zz, cmap='hot', interpolation='nearest')
plt.show()

You must be logged in to post a comment.