Forecasting Time Series Data with Convolutional Neural Networks

Convolutional neural networks(CNN) is increasingly important concept in computer science and finds more and more applications in different fields. Many posts on the web are about applying convolutional neural networks for image classification as CNN is very useful type of neural networks for image classification. But convolutional neural networks can also be used for applications other than images, such as time series prediction. This post is reviewing existing papers and web resources about applying CNN for forecasting time series data. Some resources also contain python source code.

Deep neural networks opened new opportunities for time series prediction. New types of neural networks such as LSTM (variant of the RNN), CNN were applied for time series forecasting. For example here is the link for predicting time series with LSTM. [1] You can find here also the code. The code provides nice graph with ability to compare actual data and predicted data. (See figure below, sourced from [1]) Predictions start at different points of time so you can see and compare performance for several predictions.
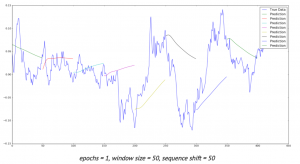
Time series with LSTM

Below review is showing different approaches that can be used for forecasting time series data with convolutional neural networks.

1. Raw Data
The simplest way to feed data into neural network is to use raw data. Here is the link [2] to results of experiments with different types of neural networks including CNN. In this study stock data such as Date,Open,High,Low,Close,Volume,Adj Close were used with 3 types of networks: MLP, CNN and RNN.

CNN architecture was used as 2-layer convolutional neural network (combination of convolution and max-pooling layers) with one fully-connected layer. To improve performance the author suggests using different features (not only scaled time series) like some technical indicators, volume of sales.
According to [12] it is common to periodically insert a Pooling layer in-between successive Convolution layers in a CNN architecture. Its function is to progressively reduce the spatial size of the representation to reduce the amount of parameters and computation in the network, and hence to also control overfitting. The Pooling Layer operates independently on every depth slice of the input and resizes it spatially, using the MAX operation.

2. Automatic Selection of Features
Transforming data before inputting to neural network is common practice. We can use feature based methods like described here in Feature-selection-time-series-forecasting-python or filtering methods like removing trend, seasonality or low pass / high pass filtering.
With deep learning it is possible to lean features automatically. For example in one research the authors introduce a deep learning framework for multivariate time series classification: Multi-Channels Deep Convolutional Neural Networks (MCDCNN). Multivariate time series are separated into univariate ones and perform feature learning on each univariate series individually. Then a
normal MLP is concatenated at the end of feature learning to do classification. [3]
The CNN architecture consists of 2 layer CNN (combination of filter, activation and pooling layers) and 2 Fully connected layers that represent classification MLP.

3. Fully Convolutional Neural Network (FCN)
In this study different neural network architectures such as Multilayer Perceptrons, Fully convolutional NN (FCN), Residual Network are proposed. For FCN authors build the final networks by stacking three convolution blocks with the filter sizes {128, 256, 128} in each block. Unlike the MCNN and MC-CNN, any pooling operation is excluded. This strategy helps to prevent overfitting. Batch normalization is applied to speed up the convergence speed and help improve generalization.

After the convolution blocks, the features are fed into a global average pooling layer instead of a fully connected layer, which largely reduces the number of weights. The final label is produced by a softmax layer. [4] Thus the architecture of neural network consists of three convolution blocks and global average pooling and softmax layers in the end.

4. Different Data Transformations
In this study [5] CNNs were trained with different data transformations, which included: the entire dataset, spatial clustering, and PCA decomposition. Data was also fit to the hidden modules of a Clockwork Recurrent Neural Network. This type of recurrent network (CRNN) has the advantage of maintaining a high-temporal-resolution memory in its hidden layers after training.

This network also overcomes the problem of the vanishing gradient found in other RNNs by partitioning the neurons in its hidden layers as different ”sub-clocks” that are able to capture the input to the network at different time steps. Here you can find more about CRNN [11]. According to this paper a clockwork RNN architecture is similar to a simple RNN with an input, output and hidden layer. The hidden layer is partitioned into g modules each with its own clock rate. Within each module the neurons are fully interconnected.

5. Analysing Multiple Time Series Relationships
This paper [6] focuses on analyzing multiple time series relationships such as correlations between them. Authors show that deep learning methods for time series processing are comparable to the other approaches and have wide opportunities for further improvement. Range of methods is discussed and code optimisations is applied for the convolutional neural network for the forecasting time series data domain.

6. Data Augmentation
In this study two approaches are proposed to artificially increase the size of training sets. The first one is based on data-augmentation techniques. The second one consists in mixing different training sets and learning the network in a semi-supervised way. The authors show that these two approaches improve the overall classification performance.

7. Encoding data as image
Another methodology for time series with convolutional neural networks that got popular with deep learning is encoding data as the image. Here data is encoded as images which feed to neural network. This enables the use of techniques from computer vision for classification.
Here [8] is the link where python script can be found for encoding data as image. It encodes data into formats such as GAF, MTF. The script has the dependencies on python modules such as Numpy, Pandas, Matplolib and Cpickle.

Theory of using image encoded data is described in [9]. In this paper a novel framework proposes to encode time series data as different types of images, namely, Gramian Angular Fields (GAF) and Markov Transition Fields (MTF).

Learning Traffic as Images:
This paper [10] proposes a convolutional neural network (CNN)-based method that learns traffic as images and predicts large-scale, network-wide traffic speed with a high accuracy. Spatiotemporal traffic dynamics are converted to images describing the time and space relations of traffic flow via a two-dimensional time-space matrix. A CNN is applied to the image following two consecutive steps: abstract traffic feature extraction and network-wide traffic speed prediction. CNN architecture consists of several convolutional and pooling layers and fully connected layer in the end for prediction.

Conclusion

Deep learning and convolutional neural networks created new opportunities for forecasting time series data domain. The above text presents different techniques that can be used in time series prediction with convolutional neural networks. The common part that we can see in most of studies is that feature extraction can be done via deep learning automatically in CNN or in other words, CNNs can learn features on their own. Below you can see architecture of CNN at very high level. The actual implementations can vary in different ways, some of them were shown above.

CNN Architecture for Forecasting Time Series Data

References

1. LSTM NEURAL NETWORK FOR TIME SERIES PREDICTION
2. Neural networks for algorithmic trading. Part One — Simple time series forecasting
3. Time Series Classification Using Multi-Channels Deep Convolutional Neural Networks
4. Time Series Classification from Scratch with Deep Neural Networks: A Strong Baseline
5. Assessing Neuroplasticity with Convolutional and Recurrent Neural Networks
6. Signal Correlation Prediction Using Convolutional Neural Networks
7. Data Augmentation for Time Series Classification using Convolutional Neural Networks.
8. Imaging-time-series-to-improve-classification-and-imputation
9. Encoding Time Series as Images for Visual Inspection and Classification Using
Tiled Convolutional Neural Networks

10. Learning Traffic as Images: A Deep Convolutional Neural Network for Large-Scale Transportation Network Speed Prediction
11. A Clockwork RNN
12. CS231n Convolutional Neural Networks for Visual Recognition

Extracting Google AdSense and Google Analytics Data for Website Analytics

Recently I decided to get information that is showing for each page of my website Google Analytics account number and all Google AdSense links on this page. Connecting this information with Google Publisher Pages data would be very useful for better analysis and understanding of ads performance.

So I created python script that is doing the following:

1. Opens file with some initial links. The initial links then are extracted into the list in computer memory.
2. Takes first link and extracts HTML text from this link.
3. Extracts Google Analytics account number from HTML. The acconneunt number usually appears on web page code on the line, formatted like this : ‘_uacct = “UA-xxxxxxxxxx”;’ The script extracts UA- number using regular expression.
4. Extracts Google AdSense information from HTML text. AdSense information is displayed within /* */ like below:

google_ad_client = “pub-xxxxxxxxx”;
/* 300×15, created 1/20/17 */
google_ad_slot = “xxxxxxxx”;
Here ‘300×15, created 1/20/17’ is default ad name.

5. Extracts all links from the same HTML text.
6. Adds links to list. Links are added to list only if they are from specific website domain.
7. Outputs extracted information to csv file. The saved information contains url, GA account number and AdSense ad names that are on the page.
8. Repeats steps 2 – 6 while there are links to process.

Here are few examples how the script can be used:

  • Lookup of page for the given ad. For example AdSense is showing clicked link and we want to know what page it was.
  • Check if all pages have GA and AdSense code inserted.
  • Check the count of AdSense ads on the page.
  • Use the data with Google Analytics and AdSense for analysis of revenue variation or conversion rate by ad size for different group of web pages.

Below you can find script source code and flow chart.


# -*- coding: utf-8 -*-

import urllib.request
import lxml.html
import csv
import time
import os
import re
import string
import requests

path="C:\\Users\\Owner\\Desktop\\2017"

filename = path + "\\" + "urlsB.csv" 

filename_info_extracted= path + "\\" + "urls_info_extracted.csv"

urls_to_skip =['search3.cgi']

def load_file(fn):
         start=0
         file_urls=[]       
         with open(fn, encoding="utf8" ) as f:
            csv_f = csv.reader(f)
            for i, row in enumerate(csv_f):
               if i >=  start  :
                 file_urls.append (row)
         return file_urls

def save_extracted_url (fn, row):
    
         if (os.path.isfile(fn)):
             m="a"
         else:
             m="w"
    
       
         with open(fn, m, encoding="utf8", newline='' ) as csvfile: 
             fieldnames = ['url', 'GA', 'GS']
             writer = csv.DictWriter(csvfile, fieldnames=fieldnames)
             if (m=="w"):
                 writer.writeheader()
             writer.writerow(row)


links_processed = []

urlsA= load_file (filename)
print ("Starting navigate...")

url_ind=0 
done=False
while not done:
 u=urlsA[url_ind] 
 new_row={} 
 print (u[0])
 print (u)
 
 try:
  connection = urllib.request.urlopen(u[0])
  print (u[0])
  print ("connected")
  dom =  lxml.html.fromstring(connection.read())
  time.sleep( 12 )
  r = requests.get(u[0])

  # Get the text of the contents
  html_content = r.text
 
  
  pat = re.compile(r"(/\*(.+?)\*/)+", re.MULTILINE)
  if pat.search(html_content) != None:
                         
             str=""
             for match in pat.finditer(html_content):
                   print ("%s: %s" % (match.start(), match.group(1)))
                   str=str+","+ match.group(1)
             new_row['GS'] = str
             
  pat1 = re.compile(r"_uacct(.+?)google_ad_client", re.MULTILINE)
  pat1 = re.compile(r"_uacct(.+?)\"(.+?)\"", re.MULTILINE)
  if pat1.search(html_content) != None:
             
             m=pat1.search(html_content)
             new_row['GA'] = m.group(2)
             
            
  links_processed.append (u) 

  new_row['url'] = u[0]  
  save_extracted_url (filename_info_extracted, new_row)
  url_ind=url_ind+1
   
  
  print (html_content)
  
  links=[]
  for link in dom.xpath('//a/@href'):
      
     a=link.split("?") 
     if "lwebzem" in a[0]:
                
         try:
            links.append (link)
            ind=string.find(link, "?")
            
            if ind >=0:
                 print ( link[:ind])
            else :
                 print (link)
                 
         except :
             print ("EXCP" + link)
         
         skip = False   
         if [link] in links_processed:
               print ("SKIPPED " + link)
               skip=True
         if link in urlsA:
               skip = True
         if urls_to_skip[0] in link:
               skip=True
         if not skip:    
              urlsA.append ([link])
              
         
 except:
     url_ind=url_ind+1        
 if url_ind > len(urlsA) :
     done=True   


3 Most Useful Examples to Add Interactivity to Graph Data Using Bokeh Library

Bokeh is a Python library for building advanced and modern data visualization web applications. Bokeh allows to add interactive controls like slider, buttons, dropdown menu and so on to the data graphs. Bokeh provides a variety of ways to embed plots and data into HTML documents including generating standalone HTML documents. [6]

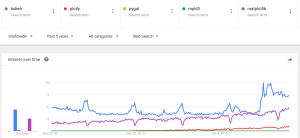
There is a sharp increase of popularity for Bokeh data visualization libraries (Fig 1), reflecting the increased interest in machine learning and data science over the last few years.

Fig 1. Trend for Bokeh and Other Data Visualizations Libraries. Source: Google Trends

In this post we put together 4 most common examples of data plots using Bokeh. The examples include such popular controls like slider, button. They use loading data from data files which is common situation in practice. The examples show how to add create plot and how to add interactivity using Bokeh and will help to make quick start in using Bokeh.

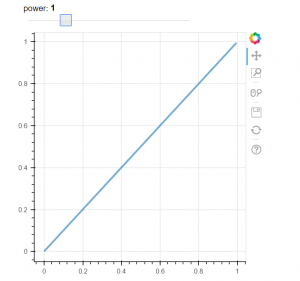
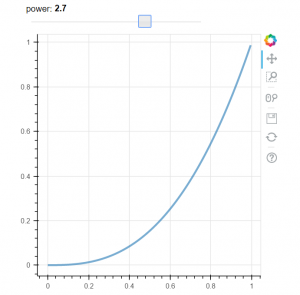
Our first example demonstrates how to add interactivity with slide control. This example is taken from Bokeh documentation [4]. When we change the slider value the line is changing its properties. See Fig 2 for example how the plot is changing. The example is using callbak function attached to slider control.


# -*- coding: utf-8 -*-

from bokeh.layouts import column
from bokeh.models import CustomJS, ColumnDataSource, Slider
from bokeh.plotting import Figure, output_file, show

# fetch and clear the document
from bokeh.io import curdoc
curdoc().clear()

output_file("callback.html")

x = [x*0.005 for x in range(0, 200)]
y = x

source = ColumnDataSource(data=dict(x=x, y=y))

plot = Figure(plot_width=400, plot_height=400)
plot.line('x', 'y', source=source, line_width=3, line_alpha=0.6)

def callback(source=source, window=None):
    data = source.data
    f = cb_obj.value
    x, y = data['x'], data['y']
    for i in range(len(x)):
        y[i] = window.Math.pow(x[i], f)
    source.trigger('change')

slider = Slider(start=0.1, end=4, value=1, step=.1, title="power",
                callback=CustomJS.from_py_func(callback))

layout = column(slider, plot)

show(layout)

Alternatively we can attach callback through the js_on_change method of Bokeh slider model:


callback = CustomJS(args=dict(source=source), code="""
    var data = source.data;
    var f = cb_obj.value
    x = data['x']
    y = data['y']
    for (i = 0; i < x.length; i++) {
        y[i] = Math.pow(x[i], f)
    }
    source.trigger('change');
""")

slider = Slider(start=0.1, end=4, value=1, step=.1, title="power")
slider.js_on_change('value', callback)
Fig 2A. Initial Data plot
Fig 2B. Data plot after changed slider position

Our second example shows how to use button control. In this example we use Button on_click method to change graph.


# -*- coding: utf-8 -*-

from bokeh.layouts import column
from bokeh.models import CustomJS, ColumnDataSource
from bokeh.plotting import Figure, output_file, show

from bokeh.io import curdoc
curdoc().clear()

from bokeh.models.widgets import Button
output_file("button.html")


x = [x*0.05 for x in range(0, 200)]
y = x

source = ColumnDataSource(data=dict(x=x, y=y))

plot = Figure(plot_width=400, plot_height=400)
plot.line('x', 'y', source=source, line_width=3, line_alpha=0.6)

callback = CustomJS(args=dict(source=source), code="""
    var data = source.data;
    x = data['x']
    y = data['y']
    for (i = 0; i < x.length; i++) {
        y[i] = Math.pow(x[i], 4)
    }
    source.trigger('change');
""")


toggle1 = Button(label="Change Graph", callback=callback, name="1")
layout = column(toggle1 , plot)

show(layout)

Our 3rd example demonstrates how to load data from csv data file. This example is borrowed from stackoverflow [5] In this example we also use button, but here we load data from file to dataframe. We use two buttons, two files and 2 dataframes, the buttons allow to switch between data files and reload the graph.


# -*- coding: utf-8 -*-
from bokeh.io import vplot
import pandas as pd
from bokeh.models import CustomJS, ColumnDataSource
from bokeh.models.widgets import Button
from bokeh.plotting import figure, output_file, show

output_file("load_data_buttons.html")

df1 = pd.read_csv("data_file_1.csv")
df2 = pd.read_csv("data_file_2.csv")

df1.columns = df1.columns.str.strip()
df2.columns = df2.columns.str.strip()
plot = figure(plot_width=400, plot_height=400, title="xxx")
source = ColumnDataSource(data=dict(x=[0, 1], y=[0, 1]))
source2 = ColumnDataSource(data=dict(x1=df1.x.values, y1=df1.y.values, 
                                    x2=df2.x.values, y2=df2.y.values))

plot.line('x', 'y', source=source, line_width=3, line_alpha=0.6)

callback = CustomJS(args=dict(source=source, source2=source2), code="""
        var data = source.get('data');
        var data2 = source2.get('data');
        data['x'] = data2['x' + cb_obj.get("name")];
        data['y'] = data2['y' + cb_obj.get("name")];
        source.trigger('change');
    """)

toggle1 = Button(label="Load data file 1", callback=callback, name="1")
toggle2 = Button(label="Load data file 2", callback=callback, name="2")

layout = vplot(toggle1, toggle2, plot)

show(layout)

As mentioned on the web, Interactive data visualizations turn plots into powerful interfaces for data exploration. [7] The shown above examples demonstrate how to make the graph data interactive and hope will help to make quick start in this direction.

References
1. 5 Python Libraries for Creating Interactive Plots
2. 10 Useful Python Data Visualization Libraries for Any Discipline
3. The Most Popular Language For Machine Learning and Data Science
4. Welcome to Bokeh
5. Load graph data from files on button click with bokeh
6. Embedding Plots and Apps
7. How effective data visualizations let users have a conversation with data


How to Write to a Google Sheet with a Python Script

My post How to Write to a Google Spreadsheet with a Perl Script that was published some time ago is still getting a lot of visitors. This is not surprising as cloud computing is a fast-growing business. Below is the chart of number of searches for phrase “Google Sheet” from Google Trends site. The usage of Google Sheet looks increasing over the years.

“Google Sheet” trend, source Google Trends

So now I decided to look how to use python for Google Sheet.

My interest to this topic also come from the idea to have Adsense and Google Analytics data on the Google Drive and do analysis in python. Keeping files on Google Drive provides access to data from different computers or devices and allows sharing with other people.

Setup
I found good post [2] that helped me quickly setup everything that is needed on Google Drive.

Despite of good instructions I run into the following minor issues:
The file on Google Drive should be shared with the email in secret key file. But this email was not the same email that I use for usual login to Google site. Google created some new email, that is starting with project name. Only when I shared the Google Sheet with that new email it started to work.

The sheet name in the below statement for opening file, for some reason did not take upper case. The actual sheet name was “Sheet1″ but the statement below worked with “sheet1″ only ( s in low case):
sheet = client.open(“filename”).sheet1

Reading and Updating Google Sheet
Here is the small example of python code showing how to read or update Google Sheet.


sheet.update_cell(1, 2, "text 34")

for i in range (2):
    sheet.update_cell(1, i+3, i)

# Returns a list of Cell objects from a specified range.
ar=sheet.range('A1:D1') 
for obj in ar:
    print (obj.value)

Once you get understanding how to do basic operation you can write more complicated code as you need. There are many benefits in using files in the cloud.

Full python source code


# -*- coding: utf-8 -*-
import gspread
from oauth2client.service_account import ServiceAccountCredentials


scope = ['https://spreadsheets.google.com/feeds']
creds = ServiceAccountCredentials.from_json_keyfile_name('client_secret.json', scope)
client = gspread.authorize(creds)

sheet = client.open("File name").sheet1
sheet.update_cell(1, 2, "text 34")

for i in range (2):
    sheet.update_cell(1, i+3, i)

### Returns a list of Cell objects from a specified range.
ar=sheet.range('A1:D1') 
for obj in ar:nprint (obj.value)

Accessing through Web
We can use the same code to access Google Sheet through web. Here is the test example with flask. Python script is navigating through 4 cells, counting the sum and displaying it on the web. To access Google Sheet we used the same code as before.
Below you can find screenshot of web page and Google Sheet.
To run this example you need:
install flask
put this python file and client_secret.json file into the same flask folder
run this python script from command line
run web browser as on the screenshot.

Retrieving the content of Google Sheet through web page with python and flask

Below is the python computer code.


from flask import Flask
app = Flask(__name__)

@app.route('/')
def index():
  return 'Hello World!'


@app.route('/user/')
def user(name):

   import gspread
   from oauth2client.service_account import ServiceAccountCredentials
   scope = ['https://spreadsheets.google.com/feeds']
   creds = ServiceAccountCredentials.from_json_keyfile_name('client_secret.json', scope)
   client = gspread.authorize(creds)

   sheet = client.open("INSERT_REPORT_NAME_HERE").sheet1
   ar=sheet.range('A1:D1')
   sum=0 
   for obj in ar:
       sum = sum + int(obj.value)
   HTML_string='Hello, {}! Total = {}'
   return HTML_string.format(name , str(sum))  

if __name__ == '__main__':
   app.run(debug=True)

References
1. How to Write to a Google Spreadsheet with a Perl Script
2. Google Spreadsheets and Python


Converting Categorical Text Variable into Binary Variables

Sometimes we might need convert categorical feature into multiple binary features. Such situation emerged while I was implementing decision tree with independent categorical variable using python sklearn.tree for the post Building Decision Trees in Python – Handling Categorical Data and it turned out that a text independent variable is not supported.

One of solution would be binary encoding, also called one-hot-encoding when we might code [‘red’,’green’,’blue’] with 3 columns, one for each category, having 1 when the category match and 0 otherwise. [1]

Here we implement the python code that makes such binary encoding. The script looks at text data column and add numerical columns with values 0 or 1 to the original data. If category word exists in the column then it will be 1 in the column for this category, otherwise 0.

The list of categories is initialized in the beginning of the script. Additionally we initialize data source file, number of column with text data, and number of first empty column on right side. The script will add columns on right side starting from first empty column.

The next step in the script is to navigate through each row and do binary conversion and update data.

Below is some example of added binary columns to data input .

Below is full source code.


# -*- coding: utf-8 -*-

import pandas as pd

words = ["adwords", "adsense","mortgage","money","loan"]
data = pd.read_csv('adwords_data5.csv', sep= ',' , header = 0)


total_rows = len(data.index)


y_text_column_index=7
y_column_index=16


for index, w in enumerate(words):
  data[w] = 0   
  col_index=data.columns.get_loc(w)
  
  for x in range (total_rows):
      if w in data.iloc[x,y_text_column_index] :
           data.iloc[x,y_column_index+index]=1
      else :
           data.iloc[x,y_column_index+index]=0  


print (data)

References
1. strings as features in decision tree/random forest
2. Building Decision Trees in Python
3. Building Decision Trees in Python – Handling Categorical Data