Can sweet food affect our mood? A friend of mine was interesting if some of his minor mood changes are caused by sugar intake from sweets like cookies. He collected and provided records and in this post we will use correlation data analysis with python pandas dataframes to check the connection between food and mood. We will create python script for this task.

Dataset from Correlation Data Analysis Between Food and Mood
Source Code for Machine Learning Correlation Data Analysis Between Food and Mood
Connection Between Eating and Mental Health
From internet resources we can confirm that relationship between how we feel and what we eat exists.[1] Sweet food is not recommended to eat as fluctuations in blood sugar cause mood swings, lack of energy [2]. The information about chocolate is however contradictory. Chocolate affects us both negatively and positively.[3] But chocolate has also sugar.
What if we eat only small amount of sweets and not each day – is there still any connection and how strong is it? The machine learning data analysis can help us to investigate this.
The Problem
So in this post we will estimate correlation between sweet food and mood based on provided daily data.
Correlation means association – more precisely it is a measure of the extent to which two variables are related. [4]
Data
The dataset has two columns, X and Y where:
X is how much sweet food was taken on daily basis, on the scale 0 – 1 , 0 is nothing, 1 means a max value.
Y is variation of mood from optimal state, on the scale 0 – 1 , 0 – means no variations or no defects, 1 means a max value.
Approach
If we calculate correlation between 2 columns of daily data we will get something around 0. However this would not show whole picture. Because the effect of the food might take action in a few days. The good or bad feeling can also stay for few days after the event that caused this feeling.
So we would need to take average data for several days for both X (looking back) and Y (looking forward). Here is the diagram that explains how data will be aggregated:

And here is how we can do this in the program:
1.for each day take average X data for last N days and take average Y data for M next days.
2.create a pandas dataframe which has now new moving averages for X and Y.
3.calculate correlation between new X and Y data
What should be N and M? We will use different values – from 1 to 14. And we will check what is the highest value for correlation.
Here is the python code to use pandas dataframe for calculating averages:
def get_data (df_pandas,k,z):

    x = np.zeros(df_pandas.shape[0])
    y = np.zeros(df_pandas.shape[0])

    new_df = pd.DataFrame() #creates a new dataframe that's empty
    for index, row in df_pandas.iterrows():

        x[index]=df_pandas.loc[index-k:index,'X'].mean()

        y[index]=df_pandas.loc[index:index+z,'Y'].mean()

    new_df=pd.concat([pd.DataFrame(x),pd.DataFrame(y)], "columns")
    new_df.columns = ['X', 'Y']

    return new_df
Correlation Data Analysis
For calculating correlation we use also pandas dataframe. Here is the code snipped for this:
for i in range (1,n):
    for j in range (1,m):

       data=get_data(df, i, j)
       corr_df.loc[i, j] = data['X'].corr(data['Y'])

print ("corr_df")
print (corr_df)
pandas.DataFrame.corr by default is calculating pearson correlation coefficient – it is the measure of the strength of the linear relationship between two variables. In our code we use this default option. [8]
Results
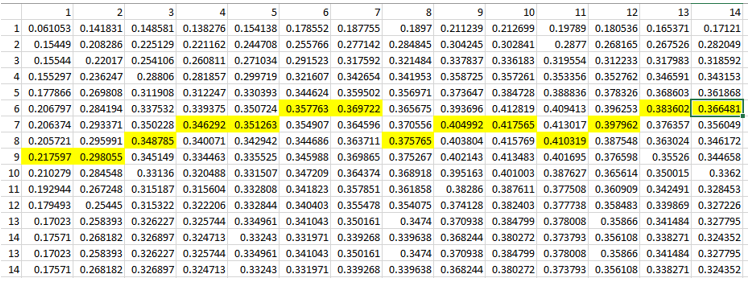
After calculating correlation coefficients we output data in the table format and plot results on heatmap using seaborn module. Below is the data output and the plot. The max value of correlation for each column is highlighted in yellow in the data table. Input data and full source code are available at [5],[6].

Conclusion
We performed correlation analysis between eating sweet food and mental health. And we confirmed that in our data example there is a moderate correlation (0.4). This correlation is showing up when we use moving averaging for 5 or 6 days. This corresponds with observation that swing mood may appear in several days, not on the same or next day after eating sweet food.
We also learned how we can estimate correlation between two time series variables X, Y.
References
1. Our Moods, Our Foods The messy relationship between how we feel and what we eat
2. Can food affect your mood? By Cynthia Ramnarace, upwave.com
3. The Effects Of Chocolate On The Emotions
4. Correlation
5. Dataset from Correlation Data Analysis Between Food and Mood
6.Source Code for Machine Learning Correlation Data Analysis Between Food and Mood
7.Calculating Correlations of Forex Currency Pairs in Python
8.pandas.DataFrame.corr
You must be logged in to post a comment.