Recently Facebook released Prophet – open source software tool for forecasting time series data.
Facebook team have implemented in Prophet two trend models that can cover many applications: a saturating growth model, and a piecewise linear model. [4]
With growth model Prophet can be used for prediction growth/decay – for example for modeling growth of population or website traffic. By default, Prophet uses a linear model for its forecast.
In this post we review main features of Prophet and will test it on prediction of stock data prices for next 10 business days. We will use python for time series programming with Prophet.
How to Use Prophet for Time Series Analysis with Python
Here is the minimal python source code to create forecast with Prophet.
import pandas as pd
from fbprophet import Prophet
The input columns should have headers as ‘ds’ and ‘y’. In the code below we run forecast for 180 days ahead for stock data, ds is our date stamp data column, and y is actual time series column
fname="C:\\Users\\data analysis\\gm.csv"
data = pd.read_csv (fname)

data.columns = ['ds', 'y']
model = Prophet()
model.fit(data); #fit the model
future_stock_data = model.make_future_dataframe(periods=180, freq = 'd')
forecast_data = model.predict(future_stock_data)
print ("Forecast data")
model.plot(forecast_data)
The result of the above code will be graph shown below.

Time series model consists of three main model components: trend, seasonality, and holidays.
We can print components using the following line
model.plot_components(forecast_data)

Can Prophet be Used for Data Stock Price Prediction?
It is interesting to know if Prophet can be use for financial market price forecasting. The practical question is how accurate forecasting with Prophet for stock data prices? Data analytics for stock market is known as hard problem as many different events influence stock prices every day. To check how it works I made forecast for 10 days ahead using actual stock data and then compared Prophet forecast with actual data.
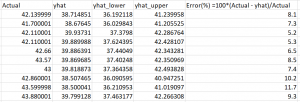
The error was calculated for each day for data stock price (closed price) and is shown below

Based on obtained results the average error is 7.9% ( this is 92% accuracy). In other words the accuracy is sort of low for stock prices prediction. But note that all errors have the same sign. May be Prophet can be used better for prediction stock market direction? This was already mentioned in another blog [2].
And also looks like the error is not changing much with the the time horizon, at least within first 10 steps. Forecasts for days 3,4,5 even have smaller error than for the day 1 and 2.
Further looking at more data would be interesting and will follow soon. Bellow is the full python source code.
import pandas as pd
from fbprophet import Prophet


fname="C:\\Users\\GM.csv"
data = pd.read_csv (fname)
data.columns = ['ds', 'y']
model = Prophet() #instantiate Prophet
model.fit(data); #fit the model with your dataframe

future_stock_data = model.make_future_dataframe(periods=10, freq = 'd')
forecast_data = model.predict(future_stock_data)

print ("Forecast data")
print (forecast_data[['ds', 'yhat', 'yhat_lower', 'yhat_upper']].tail(12))

model.plot(forecast_data)
model.plot_components(forecast_data)
References
1. Stock market forecasting with prophet
2. Can we predict stock prices with Prophet?
3. Saturating Forecasts
4. Forecasting at Scale