In the previous post I showed how to use the Prophet for time series analysis with python. I used Prophet for data stock price prediction. But it was used only for one stock and only for next 10 days.
In this post we will select more data and will test how accurate can be prediction data stock prices with Prophet.
We will select 5 stocks and will do prediction stock prices based on their historical data. You will get chance to look at the report how error is distributed across different stocks or number of days in forecast. The summary report will show that we can easy get accuracy as high as 96.8% for stock price prediction with Prophet for 20 days forecast.
Data and Parameters
The five stocks that we will select are the stocks in the price range between $20 – $50. The daily historical data are taken from the web.
For time horizon we will use 20 days. That means that we will save last 20 prices for testing and will not use for forecasting.
Experiment
For this experiment we use python script with the main loop that is iterating for each stock. Inside of the loop, Prophet is doing forecast and then error is calculated and saved for each day in forecast:
   model = Prophet() #instantiate Prophet
   model.fit(data);
   future_stock_data = model.make_future_dataframe(periods=steps_ahead, freq = 'd')
   forecast_data = model.predict(future_stock_data)

   step_count=0
   # save actual data
   for index, row in data_test.iterrows():

     results[ind][step_count][0] = row['y']
     results[ind][step_count][4] = row['ds']
     step_count=step_count + 1

   # save predicted data and calculate error
   count_index = 0
   for index, row in forecast_data.iterrows():
     if count_index >= len(data)  :

        step_count= count_index - len(data)
        results[ind][step_count][1] = row['yhat']
        results[ind][step_count][2] = results[ind][step_count][0] -  results[ind][step_count][1]
        results[ind][step_count][3] = 100 * results[ind][step_count][2] / results[ind][step_count][0]

     count_index=count_index + 1
Later on (as shown in the above python source code) we count error as difference between actual closed price and predicted. Also error is calculated in % for each day for each stock using the formula:
Error(%) = 100*(Actual-Predicted)/Actual
Results
The detailed result report can be found here. In this report you can see how error is distributed across different days. You can note that there is no significant increase in error with 20 days of forecast and the error always has the same sign for all 20 days.
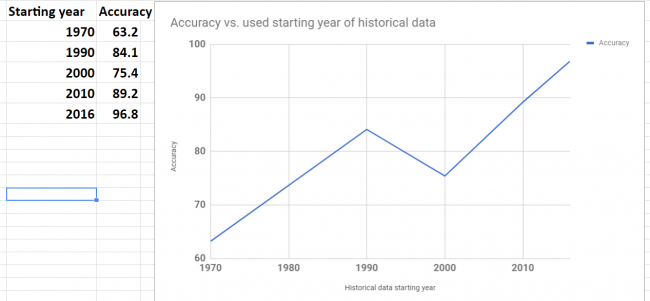
Below is the summary of error and accuracy for our selected 5 stocks. Also added the column the year of starting point of data range that was used for forecast. It turn out that all 5 stocks have different historical data range. The shortest data range was starting in the middle of 2016.

Overall results for accuracy are not great. Only one stock got good accuracy 96.8%.
Accuracy was varying for different stocks. To investigate variation I plot graph of accuracy and beginning year of historical data. The plot is shown below. Looks like there is a correlation between data range used for forecast and accuracy. This makes sense – as the data in the further past may be do more harm than good.
Looking at the plot below we see that the shortest historical range (just about for one year) showed the best accuracy.

Conclusion
We did not get good results (except one stock) in our experiments but we got the knowledge about possible range and distribution of error over the different stocks and time horizon (up to 20 days). Also it looks promising to try do forecast with different historical data range to check how it will affect performance. It would be interesting to see if the best accuracy that we got for one stock can be achieved for other stocks too.
I hope you enjoyed this post about using Prophet for prediction data stock prices. If you have any tips or anything else to add, please leave a comment in the reply box below.
Here is the script for stock data forecasting with python using Prophet.
import pandas as pd
from fbprophet import Prophet

steps_ahead = 20
fname_path="C:\\Users\\stock data folder"

fnames=['fn1.csv','fn2.csv', 'fn3.csv', 'fn4.csv', 'fn5.csv']
# output fields: actual, predicted, error, error in %, date
fields_number = 6

results= [[[0 for i in range(len(fnames))] for j in range(steps_ahead)] for k in range(fields_number)]

for ind in range(5):

   fname=fname_path + "\\" + fnames[ind]

   data = pd.read_csv (fname)

   #keep only date and close
   #delete Open, High,	Low  , Adj CLose, Volume
   data.drop(data.columns[[1, 2, 3,5,6]], axis=1)
   data.columns = ['ds', 'y', "", "", "", "", ""]

   data_test = data[-steps_ahead:]
   print (data_test)
   data = data[:-steps_ahead]
   print (data)

   model = Prophet() #instantiate Prophet
   model.fit(data);
   future_stock_data = model.make_future_dataframe(periods=steps_ahead, freq = 'd')
   forecast_data = model.predict(future_stock_data)
   print (forecast_data[['ds', 'yhat', 'yhat_lower', 'yhat_upper']].tail(12))

   step_count=0
   for index, row in data_test.iterrows():

     results[ind][step_count][0] = row['y']
     results[ind][step_count][4] = row['ds']
     step_count=step_count + 1


   count_index = 0
   for index, row in forecast_data.iterrows():
     if count_index >= len(data)  :

        step_count= count_index - len(data)
        results[ind][step_count][1] = row['yhat']
        results[ind][step_count][2] = results[ind][step_count][0] -  results[ind][step_count][1]
        results[ind][step_count][3] = 100 * results[ind][step_count][2] / results[ind][step_count][0]

     count_index=count_index + 1

for z in range (5):
  for i in range (steps_ahead):
    temp=""
    for j in range (5):
          temp=temp + " " + str(results[z][i][j])
    print (temp)


  print (z)